|
For Ongoing Reference
"Searching for Value" evaluates which money-line plays have the highest projected expected value in each week's NFL games. (I will also periodically look at NFL futures.) As sportshandle.com summarizes, "expected value... measures the probability gap between a bettor's expectations and the sportsbook's." For example, in Week 1, the sportsbooks had the Seattle Seahawks as +240 underdogs at home versus the Denver Broncos. +240 money-line odds means that you'd risk $100 to win $240. If you bet $100 on Seattle at +240 and they lose, you lose the $100; if they win, you get your initial $100 back plus $240 in winnings. By setting Seattle's money line at +240, the pre-game odds implied that the Seahawks had a 29.4% chance to win the game ("implied probability"). Positive expected value would exist if you (or some model) believed that Seattle had a higher probability to win than the 29.4% chance implied by those +240 odds. The percentiles referenced below are neither probabilities to win nor confidence levels. They indicate where the expected value of a hypothetical money-line pick falls when compared to the expected value of all potential money-line picks over the last several seasons (i.e., among several thousand possibilities). Teams in Tier 1 ("Selections") are in the 99th percentile or above when compared to all those possibilities. These are rare. Teams in Tier 2 ("Considerations") fall between the 94th and 99th percentile; according to historical back-testing, "considerations" have roughly broken even over time (hence the name). I also include a weekly Top 5 for reference, though betting all of those would have a negative return over time. The model expects to lose more games that it wins, but its selections/considerations are almost always modest to heavy underdogs. Underdogs are underdogs for a reason; the market thinks they are more likely to lose (sometimes a lot more likely) than they are to win. But for those same reasons, money-line underdogs pay more (sometimes a lot more) for victories (e.g., +240) than the amount at risk (e.g., 100). If a bettor's average money-line play is +300, they "only" need to win 25%+ of the time to break even, assuming equally sized plays. The average "consideration" in the period I've studied has carried +343 odds, occurring a little less than twice per week. The average "selection" in the period has carried +488 odds, occurring approximately once every three weeks. (This year's average odds have been much tamer so far.) If a team is listed below, it does not mean the system thinks they are likely to win their game. It means the model thinks they are more likely to win that the current money-line odds imply. And while this column focuses purely on numbers, whether you actually think that's the case is ultimately up to you and your gut! (I always check the Thursday night game, even if I don't publish a given week's article until after Thursday. If a Thursday night team falls in the 94th percentile or above, I will make a brief post and/or email the list.)
This season's top money-line expected-value plays (all 94+s are shown):
1. SEA (+240) vs. DEN - Week 1 - 99.7 percentile - Won 17-16 2. DAL (+270) vs. CIN - Week 2 - 99.5 - Won 20-17 99th percentile threshold separates "selections" from "considerations" 3. HOU (+390) at DEN - Week 2 - 98.2 - Lost 19-6 4. PIT (+380) vs. TB - Week 6 - 97.3 - Won 20-18 5. CAR (+530) vs. TB - Week 7 - 97.2 - Won 21-3 6. WAS (+240) vs. PHI - Week 3 - 96.1 - Lost 24-8 7. SEA (+310) at SFO - Week 2 - 95.9 - Lost 27-7 8. ARZ (+275) vs. PHI - Week 5 - 95.6 - Lost 20-17 9. HOU (+283) vs. IND - Week 1 - 95.6 - Tied 20-20 10. HOU (+205) vs. LAC - Week 4 - 95.5 - Lost 34-24 11. CHI (+265) vs. SFO - Week 1 - 95.4 - Won 19-10 12. DAL (+245) at PHI - Week 6 - 95.1 - Lost 26-17 13. TEN (+115) vs. LVR - Week 3 - 94.7 - Won 24-22 14. PIT (+295) at MIA - Week 7 - 94.5 - Lost 16-10
Searching for Value in Week 8
Last Week - Selections (99th-100th percentile): None - Considerations (94th-99th percentile): CAR (+530) vs. TB: Won 530, PIT (+295) at MIA: Lost 100 All money line; every selection and consideration has been a modest to heavy underdog Season to Date - Selections (99th-100th percentile): 2-0-0 (+515) - Considerations (94th-99th percentile): 4-7-1 (+590) All money line; every selection and consideration has been a modest to heavy underdog The ELDORADO model followed a big Week 6 (Pittsburgh's +380 upset of Tampa Bay) with an even bigger Week 7. On Saturday morning, I notified email subscribers that late-week line movement had pushed two games into Consideration (Tier 2) territory — namely Carolina (+530) versus Tampa Bay (97.2 percentile), and Pittsburgh (+295) at Miami (94.5 percentile). Carolina won big (21-3), while Pittsburgh came up short (16-10). At risk of stating the obvious (or restating what I state every week), going 1-1 on two sizable underdog moneyline plays makes for a very good result. If you combine Selections (Tier 1) and Considerations (Tier 2), the system is now 6-7-1 on the season, or +1105 on 1300 risked, assuming 100 per play. That's an 85% return on dollars risked. (I personally do 1/2 the amount on 94-99s as I do on 99+s, so not quite as good.) And despite my warnings that doing the entire "top five" every week would lose money over time (according to historical back-testing), last week's top five went 4-1, winning +530 (Carolina), +230 (Seattle), +195 (Washington), and +140 (New York Giants), while losing 100 on Pittsburgh. That's a +995 week on 500 risked. Weekly "top fives" are now 13-21-1 season-to-date, or +1075 on 3400 risked, assuming 100 per play. (Some quick asides: You'll note that almost all of that "top five" profit came last week. The aforementioned line movement moved Carolina ahead of Pittsburgh as the top play of Week 7. At +530, they were a 97.2, the fifth highest expected value percentile of the season; they ended up as high as +550 at Caesars, which would have pushed them to a 97.6. You can find a running list of this season's top money-line EVs above.) Week 8 is weird in that every game in the top five is at almost even odds. As weekly followers know well, this system usually sees "expected value" in modest to heavy underdogs. It's also not a very compelling week, as every team in the top five is a low-to-mid 80s play (i.e., not good). None are really even that close to consideration status. So this seems like the type of week to sit back and stand pat. Happy Halloween! This Week's Top 5: Money-line Expected Value 1. NYJ (+120) vs. NEP: 86.8 percentile - The money line implies a 45% chance for New York to win - Do you think they have a meaningfully better chance than that? - Minimum to qualify for "consideration" status is +153 2. LAR (+105) vs. SFO: 86.4 percentile - The money line implies a 49% chance for Los Angeles to win - Do you think they have a meaningfully better chance than that? - Minimum to qualify for "consideration" status is +137 3. TEN (-135) at HOU: 83.0 percentile - The money line implies a 57% chance for Tennessee to win - Do you think they have a meaningfully better chance than that? - Minimum to qualify for "consideration" status is +109 4. NOS (+110) vs. LVR: 82.5 percentile - The money line implies a 48% chance for New Orleans to win - Do you think they have a meaningfully better chance than that? - Minimum to qualify for "consideration" status is +153 5. DEN (+121) at JAX: 82.2 percentile - The money line implies a 45% chance for Denver to win - Do you think they have a meaningfully better chance than that? - Minimum to qualify for "consideration" status is +167
Searching for Value in Week 7
UPDATE (10/22/22): LINE MOVEMENT PUSHES TWO INTO "CONSIDERATION" STATUS (SEE BELOW). Last Week - Selections (99th-100th percentile): None - Considerations (94th-99th percentile): PIT (+380) vs. TB: Won 380, DAL (+245) at PHI: Lost 100 All money line; every selection and consideration has been a modest to heavy underdog Season to Date - Selections (99th-100th percentile): 2-0-0 (+515) - Considerations (94th-99th percentile): 3-6-1 (+160) All money line; every selection and consideration has been a modest to heavy underdog Last week was huge for the model, headlined by Pittsburgh upsetting Tampa Bay as a +380 home underdog. The win swung "considerations" into the black for the year. The Giants also beat the Ravens as a +215 home underdog, which the model saw as having the third-highest money-line expected value of the week. I have not been summarizing the top 5 results here each week, but they are also now in the black. Pittsburgh's win serves as a good reminder that the whole impetus for "Searching for Value" is to remove personal sentiment from the equation. As I mentioned toward the end of last week's post, I really did not like Pittsburgh. But at +380 (more specifically +315 or better), the model said there was 94th percentile expected value or better to be had. So I stayed true to the model and bet it anyway, and I'm glad I did. The win is also a good reminder of the win-loss math that underlies this system. The system's 5 victories this year — 2 as selections (99th percentile or higher), and 3 as considerations (94th to 99th percentile) — have carried average odds of +255. If you win 30% of your +255 wagers, you are in the black. So far this year, the system has won 5 out of 11 of these (with one push), which history suggests is too good to hold up. Week 7 does not currently boast any "selections" or "considerations" (how boring, I know), and its top five money-line expected value line-up is not as far up the percentile chain as last week's. Still, certain teams' odds could trip past the 94th percentile with some upward movement, and at the very least, it's always interesting to see whether/where the model(s), the oddsmakers, and you might disagree. Enjoy Week 7! This Week's Top 5: Money-line Expected Value 1. PIT (+270) at MIA: 92.2 percentile - The money line implies a 27% chance for Pittsburgh to win - Do you think they have a meaningfully better chance than that? - Minimum to qualify for "consideration" status is +290 (worth watching) UPDATE (10/22/22): I was able to get this at +295 on Friday night (FanDuel), good enough to qualify as a "Consideration" (so I took it). The best I am seeing now is +285, just below "Consideration" status. Be on the lookout! 2. CAR (+425) vs. TB: 92.2 percentile - The money line implies a 19% chance for Carolina to win - Do you think they have a meaningfully better chance than that? - Minimum to qualify for "consideration" status is +455 UPDATE (10/22/22): Carolina traded Christian McCaffrey to San Francisco on Thursday, sending their Week 7 odds to +500 on Friday night (where I took them), and as high as +530 today. They are now a "Consideration" (97.2 percentile). 3. WAS (+195) vs. GBP: 90.6 percentile - The money line implies a 34% chance for Washington to win - Do you think they have a meaningfully better chance than that? - Minimum to qualify for "consideration" status is +221 4. SEA (+230) at LAC: 90.2 percentile - The money line implies a 30% chance for Seattle to win - Do you think they have a meaningfully better chance than that? - Minimum to qualify for "consideration" status is +261 5. NYG (+140) at JAX: 84.6 percentile - The money line implies a 42% chance for New York to win - Do you think they have a meaningfully better chance than that? - Minimum to qualify for "consideration" status is +183 (Another interesting occurrence last week came in the way of line movement, as Dallas went from +235 when I posted on Saturday to +245 by Sunday afternoon. If you'd been monitoring the minimum qualification thresholds listed below each top-five entry (as again shown above), you might have noticed that this nudged Dallas into "consideration" territory. I caught it when it happened and backed them (they lost), and I've added them to the running list of "selections" and "considerations" now posted at the top. I also went back and checked whether line movement pushed any other games in or out of qualification status in the early weeks of the season. In Week 1, the Jets settled at +250 vs. the Ravens, down a good bit from an impossible-to-find +275 that had put them in the 94.1st percentile. For fairness and consistency, I have swapped in the Cowboys' Week 6 loss and swapped out the Jets' Week 1 loss from the running list at the top and from the season-to-date "consideration" results. This has a neutral effect on the overall results. Odds movement does not always mean a team should "lose" selection or consideration status in a given week. After all, if you were able to get them at or above the necessary threshold, even if they were only briefly there, that checks the box. The key is whether the "best odds out there" money line that I list in these articles, and which puts them over the threshold, is accessible, or if it's some off-consensus money line that you'd never be able to find. I'll continue to monitor this by posting minimum qualifying odds.)
Searching for Value in Week 6
LAST WEEK - Selections (99th-100th percentile): None - Considerations (94th-99th percentile): ARZ (+215) vs. PHI: Lost 20-17 All money line; every selection and consideration has been a modest to heavy underdog SEASON TO DATE - Selections (99th-100th percentile): 2-0-0 (+515) - Considerations (94th-99th percentile): 2-6-1 (-220) All money line; every selection and consideration has been a modest to heavy underdog Arizona only lost to Philly by a field goal last week, and Cleveland, which earlier in the week met the consideration threshold before line movement knocked them out, lost 30-28. If you're on the email list, I sent a notice regarding that move on Saturday, and I've updated it below. (Going forward, I will note the "odds thresholds" at which a certain team would qualify for or fall out of selection or consideration status.) Your exact odds matter, and they vary by day and sportsbook. Vegas Insider has a helpful cross-book comparison tool (be sure to filter for money line), and I'll usually reference the "most favorable line available" below. But that "best line" is often difficult to find, in part because it might only be temporarily available at some off-consensus book, and in part because you probably only have a couple of apps on your phone. So please pay attention to the "above/below" qualifying thresholds I've now noted below. THIS WEEK'S TOP 5 1. PIT (+380) vs. TB: 97.3 percentile - The money line implies a 21% chance for Pittsburgh to win. Do you think they have a meaningfully better chance than that? - Minimum to qualify for "consideration" status is +315. Becomes a "selection" at +44o or +445. 2. DAL (+235) at PHI: 93.5 percentile - The money line implies a 30% chance for Dallas to win. Do you think they have a meaningfully better chance than that? - Minimum to qualify for "consideration" status is +241. This is close, so the line movement here will be worth watching. 3. NYG (+215) vs. BAL: 92.9 percentile - The money line implies a 32% chance for New York to win. Do you think they have a meaningfully better chance than that? - Minimum to qualify for "consideration" status is +226. This is close, so the line movement here will be worth watching. 4. MIA (+150) vs. MIN: 91.8 percentile - The money line implies a 40% chance for Miami to win. Do you think they have a meaningfully better chance than that? - Minimum to qualify for "consideration" status is +166. This is close, so the line movement here will be worth watching. 5. KC (+130) vs. BUF: 90.2 percentile - The money line implies a 43% chance for Kansas City to win. Do you think they have a meaningfully better chance than that? - Minimum to qualify for "consideration" status is +153. This is close, so the line movement here will be worth watching. I say this all the time, but it bears repeating. The model does not necessarily think these teams are likely to win, and it only "wants" (or historically "expects") to win around "one out of three" or "one out of four" games. But when every pick is a modest/heavy underdog, you can end up in the black even with a losing record. Also remember that offering up the "top five" of the week is more for informational purposes — to let you see how things feel and where your own intuition takes you relative to the models. Betting the full top five would have a negative historical return. Considerations have roughly broken even over time. Selections are fun but rare. My friends often text me begging for "99s." The pressure will be on when another one comes. This is one of those weeks where "gut" and the "models" collide. For example, Pittsburgh feels crazy to me — underpriced, really, like you should be paid more than +380 for accepting that risk. (Although, as a counter to that, 50+ prediction models from across the Internet, summarized weekly by our old friend The Prediction Tracker, give Pittsburgh a 32% chance to win, better than the 21% implied by the current line.) I could see people talking themselves into Dallas, New York, Miami, or Kansas City, but when I floated the initial top five to friends, one hated Dallas ("they can get killed in Philadelphia"), another hated Kansas City ("I'm taking Buffalo to win and cover"), and some won't touch Miami with Skylar Thompson at quarterback. And that's really the point of all this. It inspires some dialogue, and as numbers-based as it intends to be, it ultimately comes down to what you think and feel. Personally, I'll go against my gut and dabble with Pittsburgh, while watching to see if any of the others move to meet the "consideration" thresholds. I might do some of them anyway, even if they don't. Just a little bit. Just to have some fun and skin in the game. Enjoy Week 6!
Searching for Value in Week 5
LAST WEEK - Selections (99th-100th percentile): None - Considerations (94th-99th percentile): HOU (+205) vs. LAC: Lost 34-24 All money line; every selection and consideration has been a modest to heavy underdog SEASON TO DATE - Selections (99th-100th percentile): 2-0-0 (+515) - Considerations (94th-99th percentile): 2-5-1 (-120) All money line; every selection and consideration has been a modest to heavy underdog There are no "selections" in Week 5. To qualify, the expected value of the money-line play must be in the 99th percentile or higher when compared to the expected value of every potential money-line play from the last several seasons. On average, this happens once every 50 games. The two that made the cut this year were Seattle (+245) in Week 1, who upset Denver, and Dallas (+270) in Week 2, who upset Cincinnati. Two teams this week do fall in the "consideration" category — Arizona (+215) hosting Philadelphia, and Cleveland (+135) hosting the Los Angeles Chargers. These are teams with expected values (based on the current odds shown below) in the 94th to 99th percentile when measured in context of the last several seasons. Remember that this percentile range has merely broken even when back-tested historically. I am also presenting this week's "top five;" note that anything below the 94th percentile has had a negative return over time. Below each team, I've indicated their "implied probability" to win based on the current money-line odds. Positive expected value exists when you — whether in your gut or based on some model — believe the team has a meaningfully better chance to win than the current money-line implies. THIS WEEK'S TOP 5 1. ARZ (+215) vs. PHI: 95.6th percentile - The money line implies a 32% chance for Arizona to win. Do you think they have a meaningfully better chance than that? - Falls below the 94th percentile at +195. Minimum to qualify for "consideration" status is +200. (I was able to get it at +215.) 2. CLE (+110) vs. LAC: 89.5th percentile - The money line implies a 48% chance for Cleveland to win. Do you think they have a meaningfully better chance than that? - Falls below the 94th percentile at +130. Minimum to qualify for "consideration" status is +135. (It's come down to +105 / +110.) 3. SEA (+2oo) at NOS: 86.5th percentile - The money line implies a 33% chance for Seattle to win. Do you think they have a meaningfully better chance than that? 4. PIT (+630) at BUF: 84.9th percentile - The money line implies a 14% chance for Pittsburgh to win. Do you think they have a meaningfully better chance than that? 5. DAL (+210) at LAR: 84.8th percentile - The money line implies a 32% chance for Dallas to win. Do you think they have a meaningfully better chance than that? To go from "considerations" to "selections," Arizona would need to move to +285 or +290, and Cleveland would need to move to +200 or +205. Both of these moves would be drastic, and they are unlikely to occur. (Update: Cleveland's best available money line was +135 in the middle of the week. At that level, they met the "consideration" threshold. However, odds that favorable were difficult to find, and by Saturday, they came down to +110 or +105. That line movement knocked them a few points out of "consideration" territory.) Enjoy Week 5!
0 Comments
Searching for Value in Week 4
As I mentioned last week, I'll be ranking the "top expected-value money-line plays of the week" going forward, which is what I focused on a few years ago. (I'll still highlight the picks that meet the ELDORADO threshold or come close, as I've done the last few weeks.) This year, when ranking the top money-value plays of the week, I am also going to show how those plays stack up relative to others this season and to thousands of games over many seasons. Let's take our successful Seattle (+245) pick in Week 1 as an example. Not only did the Seahawks carry the highest expected value of the week (and so far this season) as a money-line play at +245, they were in the 99.7th percentile in terms of expected value over several thousand potential picks in recent NFL history. Last week, the top three potential plays were Washington (+240), which lost 24-8; Tennessee (+115), which won 24-22; and New England (+135), which lost 37-26. When set in context of the last few years, Washington fell in the 96th percentile, Tennessee in the 95th percentile, and New England in the 94th percentile. Those are all pretty high percentiles, but they were not high enough to qualify. That cutoff essentially falls at the 99th percentile, which means that for every 50 games played (and therefore 100 teams to potentially play), we can expect approximately one to clear the threshold . In Week 2, Dallas (+270) actually cleared this mark, coming in at the 99.5th percentile for expected value when measured against all potential money-line plays for the last few years. And they won. Houston (+270) was in the 98th percentile and lost, and Seattle fell in the 96th percentile and lost. Here are this season's top 10 plays so far: 1. SEA (+240) vs. DEN - Week 1 - 99.7th percentile - WON 17-16 2. DAL (+270) vs. CIN - Week 2 - 99.5 - WON 20-17 ***99th percentile threshold*** 3. HOU (+390) at DEN - Week 2 - 98.2 - LOST 19-6 4. WAS (+240) vs. PHI - Week 3 - 96.1 - LOST 24-8 5. SEA (+310) at SFO - Week 2 - 95.9 - LOST 27-7 6. HOU (+283) vs. IND - Week 1 - 95.6 - TIED 20-20 7. HOU (+205) vs. LAC - Week 4 - 95.5 - TBD 8. CHI (+265) vs. SFO - Week 1 - 95.0 - WON 19-10 9. TEN (+115) vs. LVR - Week 3 - 94.7 - WON 24-22 10. NYJ (+275) vs. BAL - Week 1 - 94.1 - LOST 24-9 And here are this week's top 5 money-line expected value plays: 1. HOU (+205) vs. LAC - 95.5th percentile 2. SEA (+180) at DET - 93.3 3. NEP (+375) at GBP - 92.1 4. CHI (+152) at NYG - 88.0 5. PIT (-159) vs. NYJ - 87.2 When reviewing these, remember that the system does not necessarily think these teams are likely to win their games; it thinks they're some degree more likely to do so than the prevailing money line implies. (The exception to this is Pittsburgh in Week 4, the rare favorite to the make the list; the system basically thinks they should be heavier favorites. Still, their expected-value percentile is not very high.) That top 10 list above looks pretty good — 4 wins, 4 losses, a push, and one game not yet played — which, when you're betting on modest to heavy underdogs, is a superb outcome. At 100 units per play, that's +890 on the wins (over and above what you initially risked) and -400 on the losses, netting +490 on 800 risked, good for a 61% ROI. Nice as that sounds, if we leave this week's post latching onto any "thresholds," I would point again to the 99th percentile that I mentioned above, which basically aligns with where I initially pinned the ELDORADO cutoff. The 99th percentile and above holds up well to several years of back-testing. (In other words, this is not a standardized test where falling in the 80th or 90th percentile might feel good. The back-tested ELDORADO threshold is really high — the 99th percentile and above — so don't be fooled when you see numbers in the high 80s or low 90s, even if they make a certain week's top five.) If anything else, I would point to the 94th or 95th percentile as the threshold for "honorable mention" considerations. Prior to this year, it basically broke even via back-testing, which means that betting them would have cost time and/or stress for essentially no return. (But hopefully some entertainment, which is really the point here.) I'll keep these weekly rankings, percentiles, and thresholds in focus going forward. Enjoy Week 4!
Searching for Value in Week 3
After a solid win with Seattle +245 in Week 1, there were no official ELDORADO selections in Week 2. The three money-line picks that flirted with hitting the qualifying thresholds — Dallas, Seattle, and Houston — did not see their lines move enough to make the cut-off. Dallas needed to hit +300 versus Cincinnati; the best I saw was +285 in the middle of last week and +270 on Sunday. Seattle needed to make it all the way to +400 at San Francisco; the best I saw was +365 last week, before it came down to the low 300s (e.g., +310). And Houston needed to be +415 or better at Denver; the best I saw was +400 in the middle of last week, and then +390 over the weekend. (They basically all moved in the wrong direction.) Even though none of these became qualifying picks, I had some free plays, so I actually dabbled (equally) on all three. My historical analyses suggest that this is foolish, and that if a play doesn't meet the necessary expected-value thresholds, you should stay away. But I did it anyway (for the entertainment, I suppose), and because it was free. This trio of "honorable mention" picks went 1-2, which when you're betting fairly heavy underdogs on the money line, makes for a winning day (even if the bets weren't free). Dallas won at +270; Seattle got blown out by the 49ers (I am in the camp that thinks the 49ers are better off with Jimmy Garoppolo); and Houston was actually beating Denver into the beginning of the fourth quarter, before losing 16-9. Unfortunately — and as I warned would happen — there are no qualifying picks in Week 3, and there aren't really any "almost" or "honorable mention" picks, either. The top three considerations for the week would be Washington +240 versus Philadelphia (needs +315 to officially qualify), Tennessee +115 versus Las Vegas (needs +175), and New England +135 versus Baltimore (needs +210). If we end up with too many "officially pick-less" weeks, it might be worth bringing back the "top five expected value plays" construct that we used in 2018, at the very least to keep this interesting, and so we can track their performance week to week. For example — and I realize this sounds convenient to say — but the teams with the highest expected money-line value in each of the first two weeks were Seattle (+245) in Week 1 and Dallas (+270) in Week 2, both of which won. At current levels, Washington (+240) has the highest expected money-line value in Week 3, though it's a lot less than where Seattle and Dallas landed. So let's keep on monitoring, and I'll think about putting out money-line rankings in future weeks (a top three or five sort of thing), which will probably be more fun. I'll also take a look at the futures board some time in the next few weeks to see if there's any numerical value lurking in teams' odds to win their division, conference, or the Super Bowl. Enjoy Week 3!
Searching for Value in Week 2
Year-to-Date: 1-0 (+245); ARZ, ATL, DAL, GBP, TEN all lost in Week 1 (good for our win-total under bets) As luck — or good ELDORADO models? — would have it, Week 1 was a resounding success. Geno Smith and the Seahawks upset Russell Wilson and the Broncos in Seattle. I actually ended up getting in at +245, which made the play even more attractive than the +230 consensus when I posted the article. (It remained at +220 at several books, and I even saw a +200 out there; down in those ranges, I would have stayed away.) And while season-long bets aren't worth tracking on a weekly basis, it's worth pointing out that all five of ELDORADO's win-total "unders" went the way we wanted in Week 1. All five teams lost, which is good. There are three possible money-line plays in Week 2. As always (or almost always), they are modest to heavy underdogs. Dallas is +285 at home against Cincinnati; if that goes to +300 or higher, it qualifies. Dak Prescott is out, and Cooper Rush is starting, meaning you will have to make a subjective call. Do you believe the Cowboys have much more than a 26% chance to win the game, as the current line implies? Our friend Geno Smith is back in the mix, as the Seahawks are +365 underdogs (21.5% implied probability to win) at San Francisco; If that moves to +400 or greater, it also qualifies. And finally, Houston is a +400 underdog at Denver (20% implied probability to win); the model likes the Texans at +415 or better. As you can likely tell, the models think Seattle is undervalued and Denver is overvalued by oddsmakers thus far. Note that I am usually quoting the best underdog money line I see. Depending on where and when you look, the lines you see could be different. The important question is whether the aforementioned thresholds are met. (And as always, none of this necessarily means the model thinks the pick will win; it simply means the model thinks the team has "enough" of a better chance than the money line implies.)
Searching for Value in Week 1
The only Week 1 play that (barely) made the new Searching for Value cut is Seattle, which is a +220 or +230 home underdog against Denver. The +230 implies that Seattle has a 30% chance to win. The system doesn't think Seattle is especially likely to win; it thinks they have a better chance than that +230 line implies. (It's also important to note that the system likes Seattle at +230 or higher but not at +220 or lower.) Skeptics might also argue that the ELDORADO system hasn't adequately accounted for the Russell Wilson trade. Do you believe Geno Smith gives the Seahawks significantly more than a 30% chance to win at home? Between line variance and who's at quarterback, this week's Searching for Value "pick" is a perfect example of how a "data-based" system is still unavoidably subjective — ultimately up to you and your gut. I also plan to track five (small) win-total plays that I made a few days ago. They're all "unders" (how boring), and they grew out of a "model" (too strong a word?) that I originally started working on (and didn't revisit for several years) after taking a deep-dive into the topic for an ESPN Chalk article that I wrote four years ago. Win totals and their corresponding odds (how much you win based on how much your risk) vary a lot between sportsbooks, so you really have to be discerning, especially if you're trying to identify expected value. (The 17-game regular season also makes historical analysis a bitch, and while 2022 win totals are set in the context of 17 games, it does make betting "unders" feel a little weirder.) Anyway, here's what I did: - Arizona under 8.5 wins (-110) and 7.5 wins (+150) - Atlanta under 4.5 wins (+115) - Dallas under 9.5 wins (+135) - Green Bay under 10.5 wins (+135) and 11.5 wins (-120) - Tennessee under 8.5 wins (+120) In a typical season, the model thinks that about three of these will hit; it does not imply a clean sweep. So as with pretty much everything related to wagering on the NFL (or anything else), single events and choices — a game here or a game there, a missed or made field goal, a decision to make a play or not make a play — will materially swing results. But at the very least, it will keep me (us?) a bit more engaged.
Introduction
It's been about three-and-half years since I've posted with some consistency. Since then, and at risk of sounding cliché, "I got married, had a baby, and got a dog" — all of which has been amazing but leaves no time for ELDORADO posts, especially when the original raison d'être for this blog was to tackle topics for which the data was so hard to come by that no one had ever given the topic at hand its proper due before. While I won't be taking any of those vintage ELDORADO deep-dives in the near future, I have been pondering how I might go about dabbling again, this time in a simpler but perhaps more fun and reader-relevant way. One of the topics that's lurked in the back of my mind for much of those three-and-a-half years was the "Searching for Value: NFL Picks and Futures" column I wrote during the 2018 NFL season. Beyond being a weekly read that (some?) people (might have?) enjoyed, the column's pick system did extremely well that season, going 44-34-3 against the spread (+770, 9.5% ROI) and 26-45 on the money line (+1914, 24% ROI), as almost every money line pick was a sizable underdog. I wanted to see if there was anything to the money line piece of this, so I downloaded and back-tested many years of historical data. Unsurprisingly, and as I repeatedly warned in 2018, there was not — the exact "Searching for Value" system used in 2018 (and close variations thereof) would have lost money in several other seasons. This validated my assumption that the 2018 column's results were more a matter of small-sample, single-season luck, that the bottom eventually falls out, and that "Joe the bettor" can't beat Vegas over the long term. Still, I had the data, so I kept adapting and testing, and I ultimately built my own system. The fruits of those analyses are what I will offer you on a weekly basis during the 2022 NFL season in the form of money-line picks and periodic looks at NFL futures. As in the past, this is all based on "expected value" — trying to identify situations where you think a team has a higher probability to do something than the line implies. Given the thresholds the system has defined, we could only be looking at a handful of qualifying picks per year. That is admittedly not a good way to launch a "weekly" column, but I don't want to throw picks out there just to fill space. That also means that the system's historical pick universe is not that large, so one outcome per season can really swing results, both for that season and for the system's record overall. Finally, as objective and rules-based as I hoped to make this, some degree of subjectivity is impossible to avoid. For example, if the system supports a certain play but that team's star quarterback just got injured, do you buck the system and decide not to do it? (Some NFL prediction models out there do attempt to account for quarterback quality, but I tested gambling applications for those, and they were not pretty.)
Against the Spread
If you believe the models, then the Los Angeles Rams are the expected value play in Super Bowl LIII. According to the 50+ prediction models on The Prediction Tracker, there is a 52.7% chance that the Rams win the game outright and a 56.0% chance that they cover +2.0 points. That cover probability would naturally be a little bit higher at +2.5 points, which is where the line is at Westgate as of Thursday night. At -110, risking $110 to win $100 on the Rams +2.0 carries an expected return of $7.60, which is right around the 85th percentile for ATS plays this season. On average, it would rank as a lower top-five play in most weeks. The sample size is tiny, but top-five picks went 44-34-3 (56.4%) during the regular season (no picks in Week 17), good for a positive return of $770 (9.5% ROI) if we assume each top-five bet was "to win $100." In one sense, the Rams are this year's Eagles. Last year, my weekly column focused on five specific prediction models, and the Eagles were a unanimous five-model ATS Super Bowl pick at +4.5. Those picks finished last season at 35-22-2 (61.4%), or +$1,080 (18.3% ROI) if we assume each wager was "to win $100."
Money Line
On the moneyline side, the models forecast a 52.7% chance of a Rams win, whereas current Westgate odds have them as a +125 underdog, which implies a 44.4% chance of a Rams win. If you believe the models, then you have a 52.7% chance to win $125 and a 47.3% chance to lose $100 on Los Angeles. That nets to an expected return of $18.5 on a moneyline wager that risks $100, which is 80th percentile on the season and would just miss the top five in an average week. Top-five picks went 26-54 on the year (on almost all underdogs), finishing $1,916 (24.0% ROI) in the black if we assume each wager "risked $100." Whether you believe the models or not, always remember to weigh your conviction against the probabilities implied by the odds that you're wagering. Rams +125 suggests a 44.4% chance they'll win the game —if you think their chances are better than that, you might find value in the Rams on the moneyline. Meanwhile, Patriots -145 implies a 59.2% chance that they'll win. Do you think it's higher or lower than that?
Super Bowl Squares
If you're participating in Super Bowl Squares (or Box) Pool, check out my annual write-up on your chances of winning with every final-score combination. The analysis takes the unique steps of factoring in 2015-2018's historically weird NFL scores and each team's probability to win the game, both of which are critical to understanding your chances (but are largely ignored if you pull up any old odds article on Google). Good luck and enjoy the Super Bowl!
Regular Season Results - Against the Spread: 44-34-3 (+770) - Money Line: 26-54 (+1914, almost all dogs)
Net profit includes vigs - Assumes all bets "to win $100" (against the spread) and "risk $100" (moneyline) 
Against the Spread
At current Westgate odds (KC -3.0 -120, NO -3.5 -110, as Saturday at 1pm ET), none of the conference championship picks have positive expected value against the spread. If Chiefs -3.0 moves to -110 pricing, then they'd have some positive expected value ($3.1 on a bet to win $100), which would have been a "back end of the top five" ATS pick in some weeks this season. The only other positive expected value ATS picks this playoffs were Eagles +6 at Bears (won) and Chargers +4 at Patriots (lost).
Moneyline
The Chiefs (-170) are the only team with positive expected value on the moneyline ($1.3 on a bet that risks $100), and it certainly wouldn't have been enough to qualify is an actual pick during the season. Their -170 odds imply a 63.0% chance to win the game. The models on The Prediction Tracker gives them a 63.8% chance. (So yes, it's that thin, which is why the expected value is so low.) For every other team, the models project a lower chance to win than the odds, creating negative expected value.
Super Bowl Futures
Among the four remaining teams, those same Chiefs are the only ones with positive expected value on the Super Bowl futures board — if you believe the models, of course. If you average the Chiefs' probability to win the Super Bowl across Football Outsiders, ESPN FPI, and FiveThirtyEight, they have a 32.1% chance. Westgate currently has Kansas City priced at +250 to win the Super Bowl, which implies a 28.6% chance. If you believe the models, then the Chiefs should be priced at +210. and probably even lower than that given the books wouldn't typically price them right at their probability to win (i.e., the books have to bake in a vig). So right now, the Chiefs pay like they have a 28.6% chance, even though the models think they have a 32.1% chance. Risking $100 on the Chiefs to win $250 carries positive expected value of $12.35.
Regular Season Results - Against the Spread: 44-34-3 (+770) - Money Line: 26-54 (+1914, almost all dogs)
Net profit includes vigs - Assumes all bets "to win $100" (against the spread) and "risk $100" (moneyline) 
Week 1 - Week 2 - Week 3 - Week 4 - Week 5 - Week 6 - Week 7 - Week 8 - Week 9 - Week 10 - Week 11 - Week 12 - Week 13 - Week 14 - Week 15 - Week 16
This week's update could just as well be last week's, as the top five against-the-spread value picks continued their solid performance in Week 15, and the top five moneyline value picks stayed super hot. I'm still waiting for the other shoe to drop or a big losing streak to even things out. But we haven't seen it yet.
After going 3-2 (+90) against the spread (ATS) in Week 15 — the fourth straight 3-2 week — this column's against-the-spread picks are now 41-31-3 (+690) on the season, and they've finished in the black in seven of the last eight weeks. That's a winning percentage of 56.9% ATS and a return on dollars risked of 8.4%. Moneyline value plays have been even hotter. Powered by Philadelphia's +500 upset of the L.A. Rams — last week's top moneyline value play, and the third straight week this column won with an underdog of at least 5-to-1 in its top two picks — moneyline value plays are 26-49 (+2414) on the season. They've been positive in five of the last six weeks. and the +2414 net gain equates to a return on dollars risked of 32.2%. All but two moneyline picks have been solid to heavy underdogs, hence the high profit via a losing record. Probabilities to cover and win are sourced from the 50+ models on The Prediction Tracker. Against-the-spread expected values assume bets to win $100. Moneyline expected values assume bets that risk $100.
I. Against the Spread — Top 5 Value in Week 16
Note the mix below between even-money wagers (risk 100 to win 100), -110s (risk 110 to win 100), and -120s (risk 120 to win 100). These prices impact expected value. If all of these games were -110, the top-five order would move around a bit, the Giants would fall out of the top five, and Jacksonville would sneak in (+4.0 at Miami), with a 54.3% chance to cover according to the models, good for a $4.12 expected return. 1. DET +6.0 vs. MIN, EV, 58.6% chance to cover, $17.2 expected return on $100 wager 2. CIN +8.5 at CLE, -110, 58.5%, $12.9 3. CHI -4.0 at SFO, -110, 55.2%, $6.0 4. NYG +9.0 at IND, EV, 52.9%, $5.7 5. DEN -1.5 at SFO, -120, 57.1%, $5.6 TOP 5 VALUE Last Week: 3-2 (+90), Season: 41-31-3 (+690)
II. Money Line — Top 5 Value in Week 16
Again, all the usual here about how this works. The models think the Bengals have a 38.1% chance to win at the Browns, but their +350 moneyline odds pay out like it's a 22.2% chance. The models think that the Cardinals have a 19.3% chance to beat the Rams, but their +700 moneyline odds pay like it's a 12.5% chance. And so on and so forth for the other games. If you believe the models, there could be value. Along with Washington's now weekly "manual removal" — most models still think they're pretty good, resulting in false value relative to their point spreads and moneylines — I've taken Carolina out this week as well. Panthers' QB Cam Newton has been sidelined for the remainder of the season, and backup Taylor Heinicke will be starting in his place. Most models don't know that, and most people don't know who the hell Heinicke is, so Carolina would look misleadingly attractive as +160 underdogs at home against Atlanta. 1. CIN +350 at CLE, 22.2% prob to win (odds), 38.1% prob to win (models), $71 expected return 2. ARZ +700 vs. LAR, 12.5%, 19.3%, $54 3. DET +220 vs. MIN, 31.3%, 44.9%, $44 4. NYG +375 at IND, 21.1%, 29.3%, $39 5. BUF +650 at NEP, 13.3%, 18.3%, $38 TOP 5 VALUE Last Week: 2-3 (+320), Season: 26-49 (+2414) All but two selections have been underdogs
III. Searching for Value in NFL Futures Bets
I thought maybe I'd update the futures board this week, but alas, it wasn't meant to be. (Sorry, day job gets crazy this time of year.) I last gave the futures board a proper update in Week 14, and almost every single result carried negative expected value, so I doubt we're missing much. Hopefully I can get one posted ahead of the playoffs. Want to keep reading? I invite you to check out The Lost Art of the Shitter Read.
Moneyline odds via the Westgate Las Vegas SuperBook (December 19). Point spreads and probabilities via The Prediction Tracker (December 19).

Week 1 - Week 2 - Week 3 - Week 4 - Week 5 - Week 6 - Week 7 - Week 8 - Week 9 - Week 10 - Week 11 - Week 12 - Week 13 - Week 14 - Week 15 - Week 16
I wrote a long update for Week 14, including something of a recap of the recent success — and overall 2018 NFL season success — of these value picks. That success continued last week, with the top five weekly against-the-spread picks going 3-2 (+70) and the top five weekly moneyline picks going 2-3 (+500).
The moneyline boost came by way of Oakland (+500) beating Pittsburgh and Miami (+300) pulling off a miraculous last-play upset of New England. Baltimore (+250) lost in OT at Kansas City. Woulda been nice. The system has been positive on the against-the-spread side in six of the last seven weeks, which rolls up to a season record of 38-29-3 (+600). And it's been positive on the moneyline side in four the last five weeks, good for a season mark of 24-46 (+2094), headlined by major upsets like Buffalo +1000 over Minnesota (Week 3), Arizona +650 over Green Bay (Week 13), and Oakland +500 over Pittsburgh (Week 14). All but two moneyline picks have been solid to heavy underdogs, hence the high profit via a losing record. Probabilities to cover and win are sourced from the 50+ models on The Prediction Tracker. Against-the-spread expected values assume bets to win $100. Moneyline expected values assume bets that risk $100.
I. Against the Spread — Top 5 Value in Week 15
Starting last week, Washington has been excluded from the top five, as the change at quarterback has been too drastic for most models to capture (i.e., they still think Washington is good and misguidedly love them at prevailing spreads and moneyline levels each week). I probably should have manually removed them after the Alex Smith injury in Week 11, but I left them in in Weeks 12 and 13, and they went 0-2 ATS. 1. DET +1.5 at BUF, EV, 56.7% chance to cover, $13.4 expected return on $100 wager 2. DEN -3.0 vs. CLE, EV, 54.8%, $9.6 3. CIN -3.0 vs. OAK, -110, 55.5%, $6.5 4. PIT +1.5 vs. NEP, -120, 57.3%, $6.1 5. SEA -4.5 at SFO, -110, 54.8%, $5.0 TOP 5 VALUE Last Week: 3-2 (+70), Season: 38-29-3 (+600)
II. Money Line — Top 5 Value in Week 15
All the usual commentary here. The models think that the Eagles have a 25.2% chance to win at the Rams, but their +500 moneyline odds pay out like it's a 16.7% chance. The models think that the Cardinals have a 27.1% chance to win at the the Falcons, but their +360 moneyline odds pay out like it's a 21.7% chance. And so on and so forth for the other games listed. So if you believe the models, there could be value below. 1. PHI +500 at LAR, 17% prob to win (odds), 25% prob to win (models), $51 expected return 2. ARZ +360 at ATL, 22%, 27%, $25 3. PIT +120 vs NEP, 45%, 56%, $23 4. NYJ +275 vs. HOU, 27%, 33%, $23 5. DET +120 at BUF, 45%, 55%, $21 TOP 5 VALUE Last Week: 2-3 (+500), Season: 24-46 (+2094) All but two selections were modest to heavy underdogs
III. Searching for Value in NFL Futures Bets
I gave the futures board a hearty update last week, and almost every single result carried negative expected value, so let's sit it out this week. I'll aim to give it another good update this coming week.
Moneyline odds via the Westgate Las Vegas SuperBook (December 13). Point spreads and probabilities via The Prediction Tracker (December 13).

Week 1 - Week 2 - Week 3 - Week 4 - Week 5 - Week 6 - Week 7 - Week 8 - Week 9 - Week 10 - Week 11 - Week 12 - Week 13 - Week 14 - Week 15 - Week 16
Sports betting is mathematically designed so that you lose money, if not right away then over a period of time. Streaks of good fortune are almost always more-than-eliminated once the odds — ever so carefully and magnificently stacked against you — have enough time to do their thing. But sometimes, at certain points along the way, it can be tempting to believe in your own hot hand, or think you found some magic.
This year's NFL value picks offer one such temptation. (I encourage you to resist.) As weekly readers are familiar, these value plays apply aggregate win and cover probabilities across the 50+ models found on The Prediction Tracker to prevailing moneyline odds and point spreads. We thus identify which picks carry the highest expected value in each week's games. The picks are as reliable as your faith in the models.
When picking against the spread, teams with the highest expected value are basically the ones with the highest probability to cover. The only thing that reshuffles that deck are the odds at which a given point spread exists. You usually have to risk $110 to win $100 (-110) — but sometimes it's $120 to win $100 (-120), which drags down expected value, or $100 to win $100 (EV), which provides an expected-value boost.
On the moneyline side, positive expected value exists when the models believe that a certain outcome carries a higher probability than the odds imply. Last week, the Arizona Cardinals were +650 to win at the Green Bay Packers. Those odds implied a 13.3% chance for an Arizona victory, whereas the models saw Arizona as having a 20.9% chance to win — which they did, paying bettors $650 for every $100 they risked. It was this column's top moneyline value play of the week and second most profitable victory of the year, behind only Buffalo +1000 at Minnesota in Week 3. And it supercharged the column's running moneyline record to 22-43 — good for a hypothetical return of $1,594 if we assume $100 risked on five games per week. (All but two picks were modest to heavy underdogs — hence the high profit via a losing record.)
We'll save the real summary math and analysis for the end of the season. But if you're keeping score, that's $1,594 in hypothetical profit on $6,500 in money risked, which is good for a return of 24.5% since Week 1. Against the spread, the top five weekly picks are 35-27-3 (+$530). Assuming an average of $110 risked per game, that's $530 in hypothetical profit on $7,150 in money risked, or a net return of 7.4% since Week 1.
My disclaimers are that (a) this is a small sample size, (b) the floor will soon fall out, and (c) even if it doesn't fall out this year, the same method will get punished next year or beyond. So I caution against believing any of this. But it's fun to continue to track (and feel good about when it works). So that's what we'll do. Probabilities to cover and win are sourced from the 50+ models on The Prediction Tracker. Against-the-spread expected values assume bets to win $100. Moneyline expected values assume bets that risk $100.
I. Against the Spread — Top 5 Value in Week 14
As I've noted since the outset of the season, my goal is to remove manual overlay from this process. The situations that screw that up are major injuries, particularly to QBs with shitty backups, which the odds and lines capture but the models largely do not. Washington carried high expected values in Weeks 12 and 13 because the models liked the team at given levels, without realizing that Colt McCoy was under center. Over those two weeks, Washington made the top five against-the-spread (ATS) value list twice (went 0-2) and the top five moneyline value list once (went 0-1). Each time I offered a disclaimer but left them in. Had I subbed them out, there would have been no ATS replacement in Week 12 — there were only four teams with positive expected value — and Arizona +14 would have made the list last week and registered a win. Now that backup Colt McCoy is also injured and Mark Sanchez is at the helm — Sanchez hasn't been a full-time starter since 2012 with the New York Jets — Washington's numbers are even more messed up. They're 3.5-point underdogs at home against the New York Giants and +160 to win the game. The models love them at those levels. But that isn't fair to the spirit of the system. So this week, I am taking them out. (At season's end, I'll likely show summary results with Washington post-Alex Smith injury and without.) 1. CLE +1.5 vs. CAR, EV, 53.0% chance to cover, $5.9 expected return on $100 wager 2. SEA -3.5 vs. MIN, EV, 52.6%, $5.2 3. CIN +14 at LAC, -110, 54.6%, $4.6 4. ATL +6 at GBP, -120, 56.4%, $4.2 5. HOU -4.5 vs. IND, -110, 53.1%, $1.4 TOP 5 VALUE Last Week: 3-2 (+80), Season: 35-27-3 (+530)
II. Money Line — Top 5 Value in Week 14
Washington would have owned the number two spot on this list, but again, they've been excluded. (Had Washington been excluded in Week 12, Arizona would have taken their place and lost. So keeping them in despite the quarterback situation did not have any impact on the running moneyline tallies down below.) Cincinnati (+700) is lurking in similar territory as Arizona last week — 13% by the odds, 21% by the models. 1. CIN +700 at LAC, 13% prob to win (odds), 21% prob to win (models), $65 expected return 2. OAK +500 vs. PIT, 17%, 22%, $34 3. ATL +200 at GBP, 33%, 42%, $26 4. MIA +300 vs. NEP, 25%, 30%, $22 5. BAL +250 at KC, 29%, 33%, $15 TOP 5 VALUE Last Week: 2-3 (+530), Season: 22-43 (+1594) All but two selections were modest to heavy underdogs
III. Searching for Value in NFL Futures Bets
After a couple of weeks of broken promises, I am finally back with an updated expected value futures grid. To the unfamiliar, this grid attempts to show where positive expected value lies when evaluating teams' odds to win the division, conference, and Super Bowl. Positive expected value shows up when teams' probabilities to win those crowns — according to three leading NFL prediction models (ESPN FPI, Football Outsiders, and Massey-Peabody) — outweigh the probabilities implied by their current futures odds. As you can see from all of the red below, we haven't missed much by waiting a few weeks to revisit this. (Although who knows, maybe there was a mispriced gem lurking in the interim. But probably not.) As far as Super Bowl futures are concerned, the Kansas City Chiefs are the only team with positive expected value, and it ain't much. On average, the three models believe the Chiefs have a 20.3% chance to win the Super Bowl, while their +450 odds to do so imply an 18.2% chance. So there could be a hint of value there. Kansas City offers a similar hint of value at +200 to win the AFC, with a 39.1% chance according the models versus a 33.3% chance according to the odds. (Remember, Kansas City released star running back Kareem Hunt after a video surfaced of him physically assaulting a woman at a hotel in Cleveland. This caused the Chiefs' odds to inflate a bit since last week, as observers wonder how the change will affect the team.) Carolina has some theoretical value at +10000 to win the NFC, but that's mostly due to rounding error. The models give them a 1.2% chance to the win the conference, whereas the odds imply 1.0%. Other than the Colts at +9000 to win the AFC, which is fairly priced (1.1% chance), every single other conference or Super Bowl futures bet is mathematically configured so that the probability implied by the odds is higher than the average probabilities generated by the models — meaning they all carry negative expected value. On the division side, Kansas City (-700, implied probability of 87.5%) and Houston (-800, 88.9%) are fairly priced. Pittsburgh offers the most value among favorites — the models give them an 83% chance to win the AFC North, while their -300 odds imply 75%. Not much, but not bad. Cincinnati and Green Bay price well as rounding-error long-shots, and Washington looks misleadingly good for reasons described above. 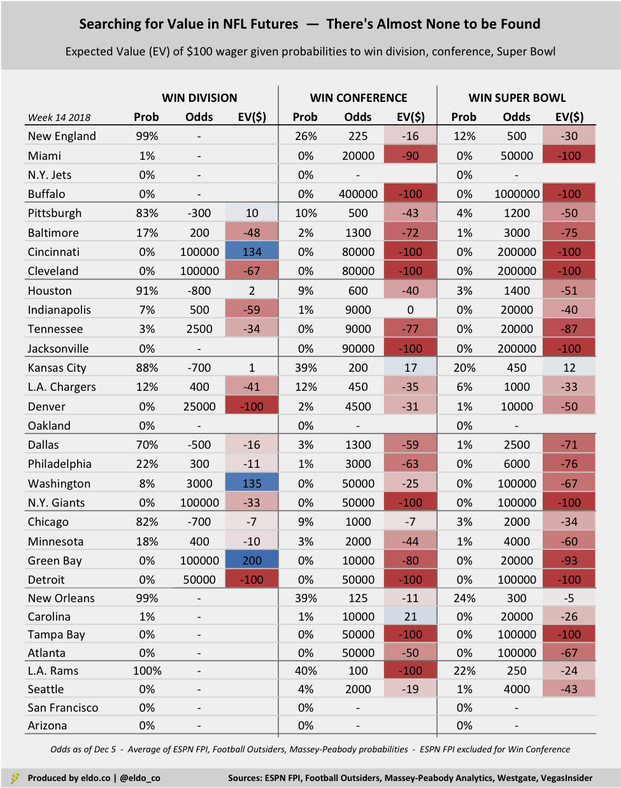
Westgate odds as of Dec 5. Vegas Insider division odds are added in for the Broncos, Lions, Texans, Colts, and Titans, Probabilities reflect the average across ESPN FPI, Football Outsiders, and Massey-Peabody. ESPN FPI does not publish probabilities to win the conference, so they are excluded for that category.

When I graduated from college in 2006, George W. Bush was President, Donald Trump was a Democrat, and most American voters didn’t know enough about Barack Obama to have an opinion of him. The financial crisis hadn’t hit. The iPhone hadn’t been released. Only 2 or 3 percent of Americans had a smartphone of any kind. Newspaper and radio were still four times as popular a news source as the internet.
A lot has changed since I was young. So says every formerly young person, I suppose. These days, we're a bunch of smartphone-addicted cyborgs. Four out of five Americans own a device. Two-thirds of us get at least some news from social media. Our politics have been hijacked by the loudest and most extreme. Our parents post on Facebook. Our teenagers are losing interest in driving and dating. There's less randomness to our days. Fewer random conversations. Fewer random walks. Fewer random thoughts. The smartphone rules all.
It's in your bed when you go to sleep, and it's the first thing you check when you wake up. It likely sounded your alarm. It guides, informs, and entertains you on your commute. It's in your hand when you watch TV, or whatever the hell you watch, beckoning you to check it if your already probably ad-free show loses momentum for a split-fucking-second. You know you'll check it, too. I hate knowing that I will.
It's next to the sink when you shower, collecting texts and emails and notifications and sometimes playing music or a podcast while you bathe. You check it when you pee, unless — maybe — you're a guy in a public bathroom and a dude pulls up at the urinal next to you and you don't want him to think you're taking pictures. But if he's relatively young, he's probably checking his phone too, so you're good.
Lost in popular discourse, however, is the degree to which smartphones have transformed one of our most fundamental (if you're regular), satisfying (if you're healthy), and peaceful (if your setup is clean and you're not in a rush) activities. I am, of course, talking about shitting.
There was a time, not long ago, when those blissfully private moments required an intoxicating mix of planning, creativity, and spontaneity, and carried with them the promise of a new, exciting, and uncertain intellectual journey. What were you going to read on the shitter? Nowadays, the device that provides infinite access to people and information has, ironically, destroyed the exhilaration, mystery, and magnificence of reading on the can — replaced instead by texting, scrolling, Twitter feeds, Instagram videos, and quick, superficial clicks.
Magic and mystery at home and on the road
Reading on the shitter was an art form unto itself. If you grew up with a father in your house, then you might have weekend memories of pops disappearing after breakfast, the only signs of life being the metronomic turn of newspaper pages from the other side of the bathroom door, or the occasional muffled yell in response to your mother's wondering where the hell he went. If he had enough time, your old man probably shit, showered, and shaved — a hallowed trifecta about which songs have been written and little debate exists. As you learned the art form yourself, you realized you could build consistency into your reading plans at home. Maybe your parents kept material in the bathroom — stacked in a basket, jammed in a bin, or atop the back of the toilet — a gesture of goodwill and recognition of shared experience. Or, at the very least, you knew where you could reliably pull a newspaper or magazine on the way in. But even then, there was haphazard beauty amidst the consistency. As a kid, you probably didn't have much say over your options — with a sister five years older than me, that meant a whole lotta Seventeen Magazine — and you never knew where your thumbing through the pages or the duration of your session might lead. When you struck long-form gold and had nowhere to be, you might go until your legs went numb, subconsciously believing that for some reason, you wouldn't be able to pick the story back up a few minutes later on the outside. The mystery and excitement were only heightened when you were in a rush or on the road. An emergency meant grabbing whatever was in arm's reach as you raced to bathroom, be it a cookbook, JCPenney catalog, or random-ass photo album. If you just busted through the front door and had to go, the mail in your hand was your best bet. At your friends' or cousins', you were relegated to whatever they had — a strange but insightful peek into their world — or nothing at all, in which case you were left to peruse the back of the shampoo bottle. A wise shitter knew how to assess the landscape during those road games, both in choosing their target and procuring material. A one-bathroom setup usually meant no reading, or at the very least only while you pushed, lest you disrespect the crowd. A second bathroom in a basement was, on the other hand, a bonanza, so long as reading options were rife. The true artist surveyed bookshelves, newspaper piles, and magazine racks in advance, and exhibited clandestine skill in securing and returning the material, unbeknownst to all.
Strategy, creativity, and camaraderie at the office
And then there was work, where the art of the shitter read — and all of the strategy, creativity, and camaraderie that go along with it — was most pronounced. My first job's floor layout featured desks around the outside of the building, with elevators and bathrooms in the middle. That meant one entrance to the bathroom on each side of the floor — a great benefit to the harried worker in search of a several-minute shitting oasis, as you could enter from one side and exit from the other with no one any the wiser, even if you just took down 2,000 words. But what to read? You can escape from the door on the other side, but people are still going to see you walk in, which often precludes a magazine or newspaper. Indeed the best option, as many of that era would surely attest, was to print a long article on regular paper, fold or roll the pages in your hand, and casually stroll on in. No such strategy exists in the smartphone era. I pity the younger generations for it. My work buddies took to referring to the experience as "taking a meeting," borrowed, I believe, from a guy who joined with us but left after three months. What a fine legacy he bequeathed. Article length was measured by how many sessions it would take to finish a story — there were one-shit reads, two-shit reads, and so on. Bill Simmons's lengthy ESPN Page 2 articles and The New York Times Magazine stories were tailor-made for the circumstances, offering two-, three- or even four-shit deep dives that people just don't undertake on smartphones. I can only speak for guys here, but shitting forges camaraderie among boys and men. (It may sound crass or juvenile, but it's true.) You know you're becoming legit friends with somebody if you can speak freely of where you're going and what you read. If you were a good friend in the pre-smartphone era, that meant bringing reading material that you really liked back out to pass on to your buddy when you were done with it. In many respects, there was no finer a reading recommendation or truer indication of blossoming friendship than that. If a printed story was good enough but not worth your buddy's time, a generous shitter might leave it in the stall for an anonymous follower to enjoy. That was part of male-stall code, itself an evolution of the once-ubiquitous leave-the-newspaper-in-the-stall-at-work maneuver. Those newspapers always seemed to take on a weird texture and smell after that thin, recycled newsprint was in there for too long. But that's the way it was, always welcomed by the next man up, predicated on a certain group understanding. A tie that binds.
All of this is sadly gone. Today's smartphone shitters still have to choose their venues wisely — upstairs, downstairs, maybe a different floor at work — and I hope that part of shitting never goes away. But they'll never know the intellectual bliss of being forced to find something interesting in a magazine they didn't choose, the magic of the back of the shampoo and conditioner bottles, the intimacy of passing a wrinkled 10-page printout to their colleague, or the strange wonder of picking a damp newspaper up off the bottom of the bathroom stall.
They say millennials were born between 1981 and 1996. But I've never really felt like one. I was born in 1984, and I don't see how someone who didn't see the internet until late middle school, still had to call girls' houses and talk to their dads, was pretty well grown by 9/11, and had a fucking landline phone in their freshman dorm room is part of the same group as someone who can't recall life before the internet. But above all, I don't see how someone who spent two-and-a-half decades shitting without a smartphone is part of the same generation as someone who can barely remember shitting without one. Smartphones have destroyed privacy, political discourse, focus, being present, cuddling, stopping for directions, listening to entire albums (I guess CDs helped kill that), writing love letters, and striking up conversation with the person sitting next to you at the bar, on the bus, or in the coffee shop. Young people have been robbed of learning the fine art of the shitter read, too. It was a joy too rich to capture in a story that's probably too long to read on your device. 
Week 1 - Week 2 - Week 3 - Week 4 - Week 5 - Week 6 - Week 7 - Week 8 - Week 9 - Week 10 - Week 11 - Week 12 - Week 13 - Week 14 - Week 15 - Week 16
Probabilities to cover and win are sourced from the 50+ models on The Prediction Tracker. Against-the-spread expected values assume bets to win $100. Moneyline expected values assume bets that risk $100.
I. Against the Spread — Top 5 Value in Week 13
This week's top five against-the-spread value picks are all underdogs, and all are pretty significant contrarian plays relative to the general public. We'll see how that pans out. Remember that the most models don't completely capture Washington's week-old situation at quarterback (i.e., Colt McCoy instead of Alex Smith). Washington just missed ATS last week (+7.5 at Dallas), and was hampered by a blown call. 1. JAX +4.0 vs. IND, -110, 56.82% chance to cover, $9.31 expected return on $100 wager 2. WAS +6.5 at PHI, -110, 56.79%, $9.26 3. CIN +4.5 vs. DEN, -110, 56.5%, $8.6 4. TAM +3.5 vs. CAR, -110, 55.5%, $6.5 5. BAL +1.5 at ATL, -110, 55.2%, $6.0 TOP 5 VALUE Last Week: 3-2 (+70), Season: 32-25-3 (+450)
II. Money Line — Top 5 Value in Week 13
All of Week 13's top five moneyline value plays are underdogs too, but we're used to seeing that here. Including this week, 63 of the 65 picks posted in this section have been underdogs. Top five moneyline value plays are 20-40 on the season, with +1004 net profit if we assume 100 was risked on each contest. The discrepancies between the probabilities to win implied by the odds (first percentage listed below) and the probabilities to win implied by the models (second percentage listed below) are fairly wide this week. But remember, you should only like a team if you believe the models more than you believe the odds. For example, the odds imply that Arizona (+650) has a 13% chance to win at Green Bay, whereas the models imply a 21% chance. And the odds imply that Oakland (+750) has a 12% chance to win at home versus Kansas City, whereas the models imply a 17% chance. To my eye, the models' probabilities seem kinda high. (Likewise for Detroit hosting the L.A. Rams.) But that's part of the fun of monitoring this stuff. 1. ARZ +650 at GBP, 13% prob to win (odds), 21% prob to win (models), $57 expected return 2. OAK +750 vs. KC, 12%, 17%, $42 3. CIN +200 vs. DEN, 33%, 46%, $39 4. DET +400 vs. LAR, 20%, 28%, $38 5. JAX +180 vs. IND, 36%, 48%, $35 TOP 5 VALUE Last Week: 1-4 (-250), Season: 20-40 (+1064) All but two selections were modest to heavy underdogs
III. Searching for Value in NFL Futures Bets
Will update the futures grid for real this week. I'm targeting end of day Wednesday. Please stay tuned! 
Moneyline odds via the Westgate Las Vegas SuperBook (December 1. Point spreads and probabilities via The Prediction Tracker (December 1).
Week 1 - Week 2 - Week 3 - Week 4 - Week 5 - Week 6 - Week 7 - Week 8 - Week 9 - Week 10 - Week 11 - Week 12 - Week 13 - Week 14 - Week 15 - Week 16
Happy Thanksgiving to all ye faithful readers. I'm squeezing in an early post this week given there are three games on Thursday. Last week, the top five value plays went 4-0-1 (+400) against the spread, and the top five moneyline value plays went 2-3 (+50, all underdogs). Those three moneyline losses came by two points (Washington), three points (Tampa Bay), and three points (Kansas City). But that's the way it goes.
Three other things to note this week. First, several of the models listed on The Prediction Tracker haven't published their picks yet, so we're dealing with fewer than normal. Second, Washington carries very high expected values at +7.5 / +275 at Dallas on Thanksgiving, but most models don't capture the fact that Washington lost starting QB Alex Smith to a gruesome injury on Sunday, and that backup Colt McCoy will be under center. In the spirit of keeping manual overlay out of this column, I've kept Washington in below. Finally, Westgate is not currently publishing a moneyline for Houston-Tennessee, so that's excluded. Probabilities to cover and win are sourced from the 50+ models on The Prediction Tracker. Against-the-spread expected values assume bets to win $100. Moneyline expected values assume bets that risk $100.
I. Against the Spread — Top 5 Value in Week 12
There are only five games this week with positive expected value against the spread, and three are really quite low. Remember, I'm keeping Washington on the list despite the largely "uncaptured" change at QB. Whether you like Washington +7.5 comes down to whether you trust Colt McCoy to keep the game close. 1. BAL -10.5 vs. OAK, -110, 57.7% chance to cover, $11.3 expected return on $100 wager 2. WAS +7.5 at DAL, -120, 59.0%, $9.7 3. TEN +6.0 at HOU, -110, 53.6%, $2.5 4. BUF +3.0 vs. JAX, EV, 51.3%, $2.4 5. TAM -3.5 vs. SFO, EV, 50.7%, $1.4 TOP 5 VALUE Last Week: 4-0-1 (+400), Season: 29-23-3 (+380)
II. Money Line — Top 5 Value in Week 12
Same comment here as above regarding Washington. Their +275 moneyline odds imply a 26.7% probability to win at Dallas, whereas the models — largely blind to the Alex Smith injury — see Washington — or would have seen them — as having a 41% chance. So in order to like Washington at +275 on the moneyline, you would need to think they have a better-than-27% chance to win outright. And ideally more than that. Remember, converting moneyline odds to implied win probabilities — and then comparing those implied probabilities to your own view of a team's chances to win — is generally a clearer way to think about what moneyline odds mean. For example, the odds suggest that the Jets (+375) have a 21.1% chance to beat New England at home, and Atlanta (+550) has a 15.4% chance to win at New Orleans. What do you think? 1. WAS +275 at DAL, 27% prob to win (odds), 41% prob to win (models), $55 expected return 2. NYJ +375 vs. NEP, 21%, 29%, $36 3. ATL +550 at NOS, 15%, 20%, $28 4. MIA +325 at IND, 24%, 28%, $18 5. SEA +150 at CAR, 40%, 44%, $9 TOP 5 VALUE Last Week: 2-3 (+50), Season: 19-36 (+1314) All but two selections were modest to heavy underdogs
III. Searching for Value in NFL Futures Bets
I'll refresh the expected-value futures board after Thanksgiving. You can peek back at Week 9's update, or check out my midseason NFL betting review on ESPN, which includes a discussion of Super Bowl odds. 
Moneyline odds via the Westgate Las Vegas SuperBook (November 20). Point spreads and probabilities via The Prediction Tracker (November 20).
|
|
 RSS Feed