Your 2023 Super Bowl Squares Odds
How historically weird scores and Eagles-Chiefs win probabilities impact your chances
FEB 3 2023
Annual Odds (Year of Game): 2023 - 2021 - 2020 - 2019 - 2018 - 2017 - 2016
Not Your Granddaddy's Super Bowl Boxes
How historically weird scores and Eagles-Chiefs win probabilities impact your chances
FEB 3 2023
Annual Odds (Year of Game): 2023 - 2021 - 2020 - 2019 - 2018 - 2017 - 2016
Not Your Granddaddy's Super Bowl Boxes
If you’re participating in a Super Bowl Squares Pool and would like to know your chances of winning with a certain final-score combination, here they are. These probabilities do two key things that most other Super Bowl Squares grids you'll find on the internet do not:
First, they factor in the impact of 2015-2022’s historically weird NFL scores, which were ushered in by — but are not exclusively attributable to — the NFL's decision to move the extra point back from 20 to 33 yards before the 2015 season. Second, they factor in each Super Bowl team’s probability to win the game (according to Vegas). Both of these often-overlooked elements are key to understanding your odds.
First, they factor in the impact of 2015-2022’s historically weird NFL scores, which were ushered in by — but are not exclusively attributable to — the NFL's decision to move the extra point back from 20 to 33 yards before the 2015 season. Second, they factor in each Super Bowl team’s probability to win the game (according to Vegas). Both of these often-overlooked elements are key to understanding your odds.
Also known as Super Bowl Boxes, though far less commonly so
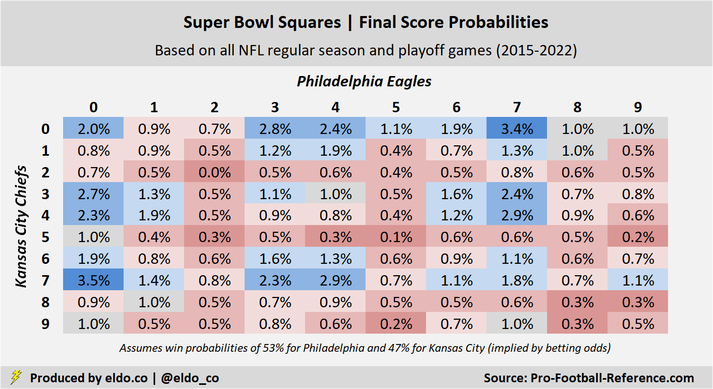
Super Bowl 57’s best final-score number combination is [Eagles 0, Chiefs 7], followed closely by its inverse [Chiefs 0, Eagles 7]. Thirty-five pairs give you an above-average (>1%) chance to win, and the top 12 pairs own almost one-third of the board's probabilities. The worst draw is a pair of twos, which has happened only three times in the 13,557 regular season or playoff games in the Super Bowl era (since 1966).
If you'd like to learn more about why 2015-2022's weird NFL scores and each Super Bowl team's win probabilities matter, please read on!
If you'd like to learn more about why 2015-2022's weird NFL scores and each Super Bowl team's win probabilities matter, please read on!
|
|
What are weird scores and why do they matter?
Those of you familiar with ELDORADO know that I’ve tracked and analyzed the changing face of NFL scores over the past few seasons.
The short version is that before the 2015 season, the league moved the extra point back from 20 yards, where kickers converted 99% of the time, to 33 yards, where they’ve made 94% of kicks over the past eight seasons. The only periods in NFL history when kickers performed worse on extra points were the mid-to-late 1970s, right after the goal posts were moved to the back of the end zone, and before 1948.
Combined with other aspects of the modern game — namely the proliferation of field goals and existence of the two-point conversion — the move has given rise to the weirdest scores in NFL history. Even more precisely, it is the combination of these factors — missed extra points, made field goals, and two-point conversion attempts — at historic levels all at once that has made scores so weird.
Since 2015, 19.9% of individual team scores have been “non-traditional” (18, 19, 22, 26, 33, etc.), compared with an average of 13.6% from 1994 (when the two-point conversion was introduced) to 2014 (before the extra point was moved back). From 1922 to 2014, only 9.5% were "non-traditional," cementing "traditional" football scores (17, 21, 24, 28, 31, etc.) in the American consciousness. The 2015 and 2016 seasons set records for weird scores. 2017, 2018, and 2019 came in right behind. 2020 and 2021 surpassed them all. 2022 was the fourth-weirdest ever.
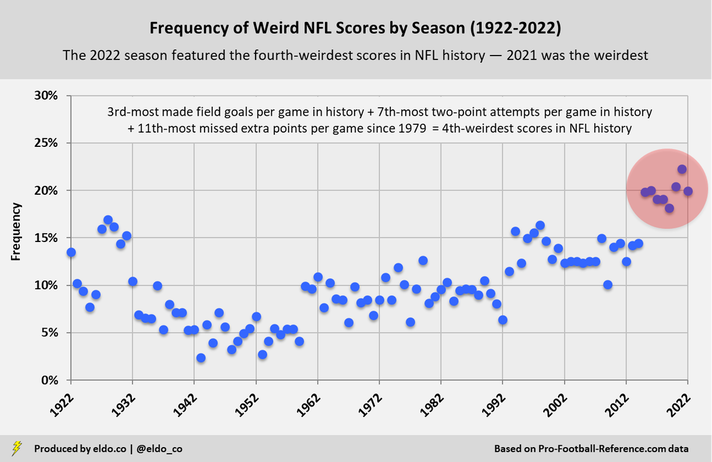
2015-2022 is 4.1 standard deviations above the 1994-2014 mean
As a result, you can no longer rely on final scores from "all of NFL history" or "the Super Bowl era" or "since the AFL-NFL merger" or even "recent history" to figure out how good your Super Bowl Squares are. We need to focus on the "weird score era" instead (2015 onward).
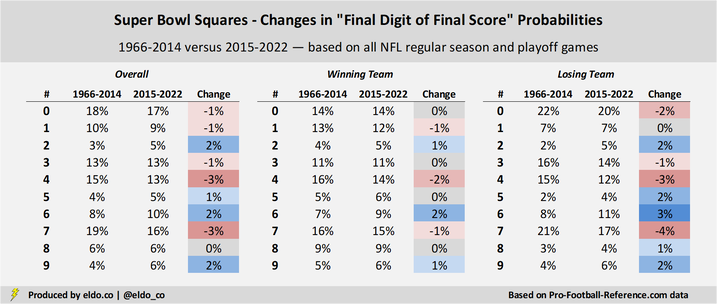
Practically speaking, the "weird score era" has made Super Bowl Squares more equitable. Traditional NFL final-digit stalwarts zero, one, three, four, and seven have ceded over seven percentage points’ worth of final-score probability to less-common numbers two, five, six, eight, and nine. Since 2015, we've experienced seven of the eight lowest frequencies of final scores ending in zero, one, three, four, or seven dating back to 1932. (The other season in that group of eight is 1994, when the NFL introduced the two-point conversion.)
Four and seven are still among the best numbers you can draw — they’re just not as good as they were before. Two, five, eight, and nine are still the four worst numbers — they’re just not as bad as they were before. And zero now edges out seven as the best digit on the board.
Due to rounding, certain changes will not appear to sum
|
|
Why is it important to factor in win probabilities?
The other thing you'll rarely find as you scan the internet for Super Bowl Squares odds is the inclusion of each team's win probability. For purposes of this year's Super Bowl, I've again used the win probabilities implied by the moneyline, which most books have at [Eagles -125, Chiefs +105] as of February 3. This implies a 53% chance that the Eagles will win and a 47% chance that the Chiefs will win, after you net out the vig. (The moneyline leans more toward the Eagles than the prediction-model consensus, which basically thinks the game's a toss-up.)
In any event, certain final-score numbers are better for winning teams than they are for losing teams. So your chances to win with a given Super Bowl Square are influenced by which team is tied to which number. This doesn't matter as much this year because the teams are evenly matched, though it could influence who you root for or come into play if one team starts pulling ahead. (Live odds would be cool!)
To illustrate this, let's look at the difference between [8 winning team, 7 losing team] and [7 winning team, 8 losing team]. The probability of one team finishing with a final digit of eight and the other with a final digit of seven is 1.34%. At the start of an evenly matched game, squares [8, 7] and [7, 8] would each have a 0.67% chance to win, or half of 1.34%. But almost all of that probability comes from [8 winning team, 7 losing team]. The inverse, [7 winning team, 8 losing team], has happened only 11 times in the NFL's 13,577 games in the Super Bowl era.
In short, the person with the eight on the side of the team more likely to win is in better shape. So if you draw [8, 7] or [7, 8], you should probably root for the team with the 8 to pull ahead and win. But really, who the hell knows, so good luck and enjoy the Super Bowl!

|
|
Source for this article is pro-football-reference.com. Data was compiled and analyzed by ELDORADO. All charts and graphics were created by ELDORADO.
ELDORADO | eldo.co | @eldo_co
ELDORADO | eldo.co | @eldo_co
