NEW: 2023 Super Bowl Squares Odds
Check out this year's probabilities!
Check out this year's probabilities!
Your 2017 Super Bowl Box Odds
How historically weird scores and Patriots-Falcons win probabilities impact your chances
JAN 22 2017 | UPDATED JAN 24
Annual Odds (Year of Game): 2023 -2021 - 2020 - 2019 - 2018 - 2017 - 2016
Not Your Granddaddy's Super Bowl Boxes
How historically weird scores and Patriots-Falcons win probabilities impact your chances
JAN 22 2017 | UPDATED JAN 24
Annual Odds (Year of Game): 2023 -2021 - 2020 - 2019 - 2018 - 2017 - 2016
Not Your Granddaddy's Super Bowl Boxes
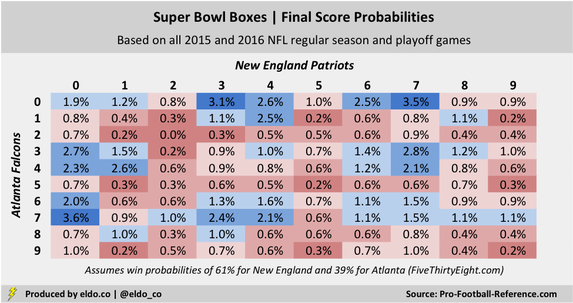
If you’re participating in a Super Bowl Box Pool this year and want to know your chances of winning with a certain final-score combination, here they are. These probabilities take into account (a) the impact of 2015 and 2016’s historically weird NFL scores and (b) each team’s win probability (per FiveThirtyEight). Both elements are critical to understanding your odds.
Also known as Super Bowl Squares (it turns out far more commonly so)
|
|
What are weird scores and why do they matter?
Those of you familiar with ELDORADO know that I’ve been fascinated by the changing face of NFL scores over the past two seasons. The short version – as NFL fans know well – is that before the 2015 season, the league moved the extra point back from 20 yards, where kickers converted 99% of the time, to 33 yards, where they’ve made 94% of kicks (lowest since 1979).
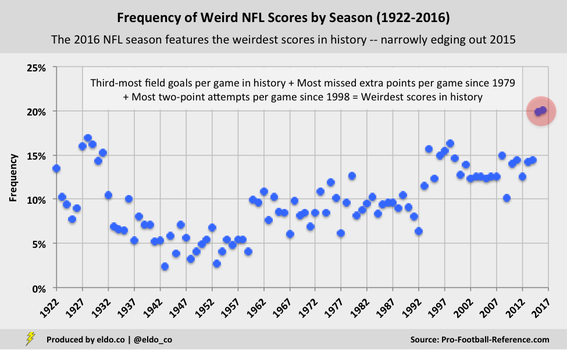
Combined with other aspects of the modern game – namely the proliferation of field goals and the existence of the two-point conversion – the move gave rise to the weirdest scores in NFL history. In 2015 and 2016, 20% of individual team scores were “non-traditional” (18, 19, 22, 26, 33, etc.), compared with averages of 13.6% from 1994 to 2014 and 9.5% all-time. Both seasons set records for weird scores.
2016's frequency is 4.3 standard deviations above the 1994-2014 mean
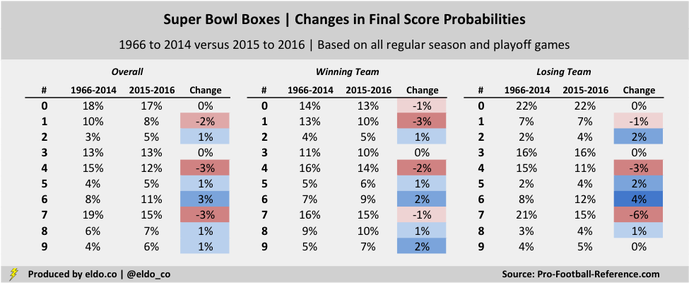
My dive down the weird-score rabbit hole is admittedly the stuff of strange intrigue (though I’d argue there’s some cultural significance to the fact that 24-7s and 21-17s are giving way to 26-6s and 18-16s). I’ve also explored whether weird scores are affecting margins of victory (which carries broader gambling implications), but that does not appear to be the case. Nevertheless, they've altered the Super Bowl Box board and shifted around your chances to win:
Due to rounding, certain changes will not appear to sum
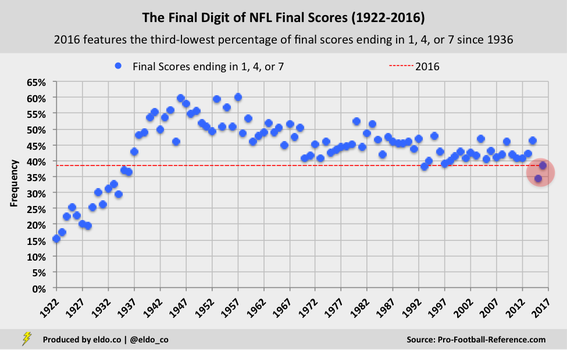
The 2015 and 2016 NFL seasons featured the lowest and third-lowest percentage of final scores ending in one, four, or seven since 1936. These traditional stalwarts ceded eight percentage points' worth of final-digit-of-final-score probability to less-common numbers two, five, six, eight, and nine (see red above).
Four and seven are still among the best numbers you can draw – they’re just not as good as they were before. Two, five, and nine are still the three worst numbers – they’re just not as bad as they were before. And zero – ever strong – may now be the best number on the board.
Four and seven are still among the best numbers you can draw – they’re just not as good as they were before. Two, five, and nine are still the three worst numbers – they’re just not as bad as they were before. And zero – ever strong – may now be the best number on the board.
|
|
Why is it important to factor in win probabilities?
Certain numbers are better for winning teams than for losing teams, and your chances to win with a given pair are influenced by which team is tied to which number. Let's walk through an example:
Assume Person A draws [Patriots 8, Falcons 7] and Person B draws [Patriots 7, Falcons 8]. The probability of one team finishing with a final digit of eight and the other with a final digit of seven is 1.88%. At the start of an equally matched game, Persons A and B would each have a 0.94% chance to win, or half of 1.88%.
In reality, those two boxes are not created equal. [8 winning team, 7 losing team] is a top-twenty pair (1.69%), while [7 winning team, 8 losing team] is one of the worst pairs on the board (0.19%). As a result, the person with the eight on the side of the team more likely to win is in better shape.
This year, Person A with [Patriots 8, Falcons 7] has a 1.1% chance to win, while Person B with [Patriots 7, Falcons 8] has a 0.8% chance. Person A is better off because the Patriots are more likely to win the game (61%). In other words, Person A is more likely to end up with [8 winning team, 7 losing team] and its 1.69% probability than they are to end up with [7 winning team, 8 losing team] and its 0.19% probability.
In most versions of the game, you can't control which numbers you end up with. So when it comes time for the random draw, may the odds be ever in your favor. Good luck and enjoy the Super Bowl!
|
|
Footnotes
The probabilities above are specific to final scores and do not cover first-quarter, halftime, or third-quarter scores. If you’re unfamiliar with Super Bowl Boxes (also known as Squares, which is technically a more accurate description), click here to learn more about how they work.
The probabilities assume that Super Bowl 51 is an extension of all NFL games played during the 2015 and 2016 seasons, which is admittedly not a perfect assumption. Elite teams with a lot at stake playing in good weather influences decisions, performances, and scores, and our sample size through the conference championships is still only 531 games, so there’s room for noise.
But with their unprecedented combination of field goals, missed extra points, and two-point conversions, those 531 games are the best reflection of how the game is played and scored today, and thus give us the best basis to assess this season’s Super Bowl Box probabilities.
As much fun as it will be to see how the Super Bowl Boxes shake out, it will be equally fun to see which (if any) of the causes of weird scores – four, five, or six field goals by one team, missed extra points, two-point conversions, safeties, or an OT touchdown – rear their heads in the biggest game of all. (Last year’s game would have been 22-10 had Denver failed a late two-point conversion.)
The data source for this article is pro-football-reference.com. Data includes both the NFL and AFL regular season and playoffs. Data was compiled and analyzed by ELDORADO. All charts and graphics herein were created by ELDORADO.
ELDORADO | Berkeley, CA | New York, NY
eldo.co | @eldo_co
ELDORADO | Berkeley, CA | New York, NY
eldo.co | @eldo_co


