NEW: 2023 Super Bowl Squares Odds
Check out this year's probabilities!
Check out this year's probabilities!
Your 2021 Super Bowl Squares Odds
How historically weird scores and Chiefs-Bucs win probabilities impact your chances
FEB 2 2021
Annual Odds (Year of Game): 2023 - 2021 - 2020 - 2019 - 2018 - 2017 - 2016
Not Your Granddaddy's Super Bowl Boxes
How historically weird scores and Chiefs-Bucs win probabilities impact your chances
FEB 2 2021
Annual Odds (Year of Game): 2023 - 2021 - 2020 - 2019 - 2018 - 2017 - 2016
Not Your Granddaddy's Super Bowl Boxes
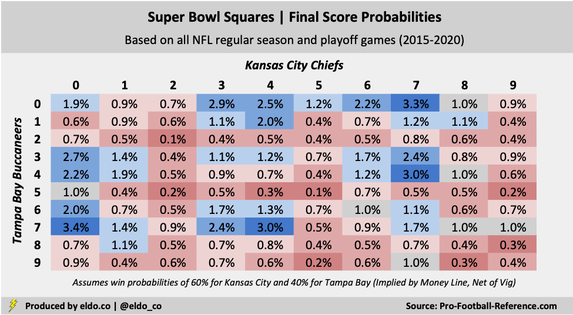
If you’re participating in a Super Bowl Squares Pool and would like to know your chances of winning with a certain final-score combination, here they are. These probabilities do two key things that most other Super Bowl Squares grids you'll find on the internet do not.
First, they factor in the impact of 2015-2020’s historically weird NFL scores, which were ushered in by — but are not exclusively attributable to — the NFL's decision to move the extra point back from 20 to 33 yards before the 2015 season. Second, they factor in each Super Bowl team’s probability to win the game (according to Vegas). Both of these often-overlooked elements are critical to understanding your odds.
First, they factor in the impact of 2015-2020’s historically weird NFL scores, which were ushered in by — but are not exclusively attributable to — the NFL's decision to move the extra point back from 20 to 33 yards before the 2015 season. Second, they factor in each Super Bowl team’s probability to win the game (according to Vegas). Both of these often-overlooked elements are critical to understanding your odds.
Also known as Super Bowl Boxes, though far less commonly so
Super Bowl 55’s best final-score number combination is [Chiefs 0, Bucs 7], followed closely by its inverse [Bucs 0, Chiefs 7]. Thirty-two pairs give you an above-average (>1%) chance to win, and the top 12 pairs own almost one-third of the board's probabilities. The worst draw is a pair of twos, which has happened only three times in the 12,988 regular season or playoff games in the Super Bowl era (since 1966).
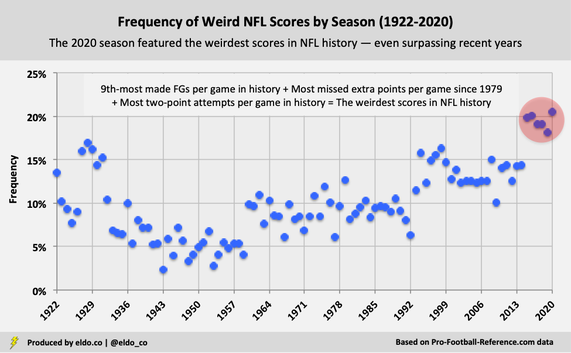
If you'd like to learn more about why 2015-2020's weird NFL scores and each Super Bowl team's win probabilities matter, please read on! I should note in advance that the most recent NFL season actually had the weirdest scores in all of NFL history, fueled by a lot of field goals, the most missed extra points per game since 1979, and the most two-point conversion attempts per game since their introduction in 1994.
(The points and stats people out there might also be curious to know that 2020 has been the highest-scoring season in NFL history, with an average of 49.7 total points per game. The median winning team score is 30 points, highest in history and up from 28- and 27-point levels in recent years, and the median losing team score is 20 points, also the highest in history, and up from 16- and 17-point levels of late.)
|
|
What are weird scores and why do they matter?
Those of you familiar with ELDORADO know that I’ve tracked and analyzed the changing face of NFL scores over the past few seasons.
The short version — as NFL fans know well — is that before the 2015 season, the league moved the extra point back from 20 yards, where kickers converted 99% of the time, to 33 yards, where they’ve made 94% of kicks over the past six regular seasons. In the most recent regular season, kickers' extra-point conversion rate fell to 93%, the lowest since 1979. The only periods in history when kickers performed worse on extra points were the mid-to-late 1970s, right after the goal posts were moved to the back of the end zone, and before 1948.
Combined with other aspects of the modern game — namely the proliferation of field goals and existence of the two-point conversion — the move has given rise to the weirdest scores in NFL history. As highlighted in my original articles, it is the combination of these factors — missed extra points, made field goals, and two-point conversions — at historic levels all at once that has made scores so weird. (Again, 2020 featured the most two-point attempts per game in history, which can make scores screwy whether they're made or missed.)
Since 2015, 19.5% of individual team scores have been “non-traditional” (18, 19, 22, 26, 33, etc.), compared with averages of 13.6% from 1994 to 2014 (from when the two-point conversion was introduced to when the extra point was moved back). From 1922 to 2014, only 9.5% were "non-traditional," which cemented "traditional" football scores (17, 21, 24, 28, 31, etc.) in the American consciousness. The 2015 and 2016 seasons set records for weird scores. The 2017, 2018, and 2019 seasons came in right behind. Now the 2020 season has surpassed them all.
2015-2020 is 3.9 standard deviations above the 1994-2014 mean
As a result, you can no longer rely on final scores from "all of NFL history" or "the Super Bowl era" or "since the AFL-NFL merger" or even "recent history" to figure out how good your Super Bowl Squares are. We need to focus on the "weird score era" instead (2015 onward).
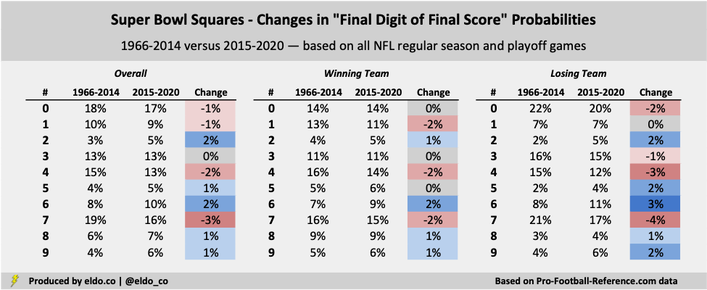
Practically speaking, the "weird score era" has made Super Bowl Squares more equitable. Traditional NFL final-digit stalwarts zero, one, four, and seven have ceded just over seven percentage points’ worth of final-score probability to less-common numbers two, five, six, eight, and nine. Since 2015, we've experienced four of the five lowest frequencies of final scores ending in zero, one, four, or seven dating back to 1932.
Four and seven are still among the best numbers you can draw — they’re just not as good as they were before. Two, five, eight, and nine are still the four worst numbers — they’re just not as bad as they were before. And zero now edges out seven as the best digit on the board.
Due to rounding, certain changes will not appear to sum
|
|
Why is it important to factor in win probabilities?
The other thing you'll rarely find as you scan the internet for Super Bowl Squares odds is the inclusion of each team's win probability. For purposes of this year's Super Bowl, I've again used the win probabilities implied by the money line, which William Hill has at [Chiefs -165, Bucs +145] as of February 1. This implies a 60% chance that the Chiefs will win and a 40% chance that the Bucs will win, after you net out the vig. (The money line leans more toward the Chiefs than the prediction-model consensus, which gives Kansas City a 54% chance to win.)
In any case, certain final-score numbers are better for winning teams than they are for losing teams. So your chances to win with a given Super Bowl Square are influenced by which team is tied to which number. Assume, for example, that Person A draws [Chiefs 8, Bucs 7] and Person B draws [Chiefs 7, Bucs 8]. The probability of one team finishing with a final digit of eight and the other with a final digit of seven is 1.68%. So at the start of an equally matched NFL game, Persons A and B would each have a 0.84% chance to win, or half of 1.68% apiece.
But in reality, those two boxes are not created equal. [8 winning team, 7 losing team] is the 26th-best number pair (1.43% final-score probability) out of the 100 you can draw, while [7 winning team, 8 losing team] is one of the worst pairs on the board (0.25%). In fact, [7 winning team, 8 losing team], has happened only 11 times in the NFL's 12,988 regular season and playoff games in the Super Bowl era (albeit four times in the last six seasons). So in short, the person with the eight on the side of the team more likely to win is in better shape.
This year, Person A with [Chiefs 8, Bucs 7] has a 0.97% chance to win, while Person B with [Chiefs 7, Bucs 8] has a 0.72% chance. Person A is a little better off because the Chiefs are a little more likely to win the game (60% vs 40%). In other words, Person A is more apt to end up with [8 winning team, 7 losing team] and its 1.43% probability than they are to end up with [7 winning team, 8 losing team] and its 0.25% chance.
Good luck and enjoy the Super Bowl!

|
|
The data source for this article is pro-football-reference.com. Data includes both the NFL and AFL regular season and playoffs unless otherwise stated. Data was compiled and analyzed by ELDORADO. All charts and graphics herein were created by ELDORADO.
ELDORADO | Berkeley, CA | New York, NY
eldo.co | @eldo_co
ELDORADO | Berkeley, CA | New York, NY
eldo.co | @eldo_co
