|
Week 1 - Week 2 - Week 3 - Week 4 - Week 5 - Week 6 - Week 7 - Week 8 - Week 9 - Week 10 - Week 11 - Week 12 - Week 13 - Week 14 - Week 15 - Week 16
Hope everyone's having a nice weekend and looking forward to Week 2. I'll try to get this up earlier in the week in the future, and for simplicity's sake, I'm going to try to streamline the flow as much as possible.
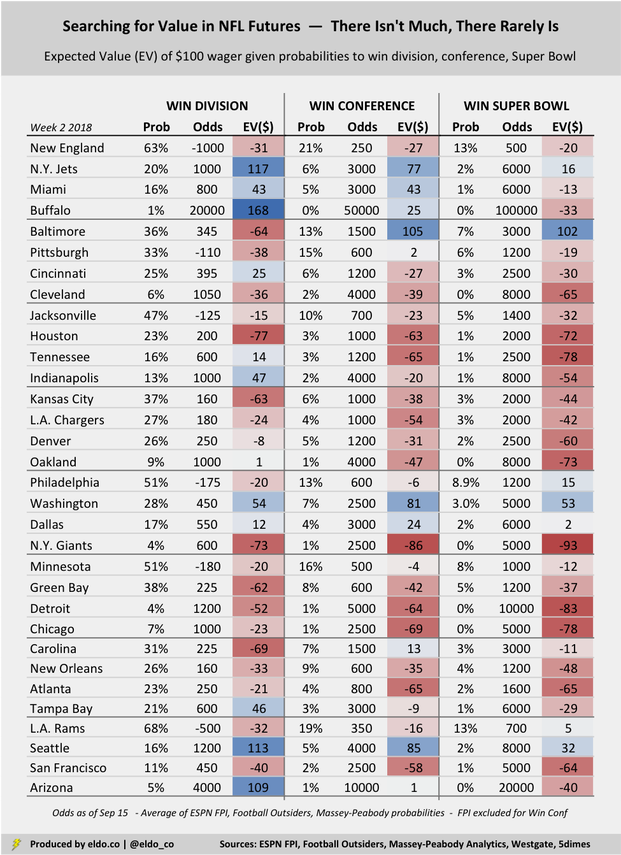
Every week, I'll summarize top five against-the-spread value plays and top five moneyline value plays. Both are based on teams' aggregate probabilities to cover or win across the 50+ NFL prediction models on The Prediction Tracker. I apply those probabilities to Westgate odds to produce expected values. I'll also post an updated summary of NFL futures values for all 32 NFL teams. In this case, I'm applying teams' average probabilities to win the division, conference, and Super Bowl across ESPN FPI, Football Outsiders, and Massey-Peabody Analytics to their Westgate futures odds to produce expected values. I am not suggesting that you bet these. In fact, the expected value of all of the futures below is negative. Good luck trying to win when the odds are literally stacked against you. Nevertheless, I find it interesting to see where the value potentially lies. (Please revisit Week 1 for more information about methodology.)
I. Against the Spread — Top 5 Value in Week 2
1. Tennessee +3.0 vs. Houston (even) — 70% chance to cover 2. Dallas -3.0 vs. N.Y. Giants (-110) — 62% chance to cover 3. New Orleans -9.5 vs. Cleveland (-110) — 59.3% chance to cover 4. Minnesota -0.0 at Green Bay (-110) — 59.2% chance to cover 5. Baltimore -0.0 at Cincinnati (-110) — 58.9% chance to cover For the second week in a row, the team playing the Houston Texans has the highest expected value against the spread, and the teams playing the N.Y. Giants and Cleveland Browns aren't far behind. That suggests that oddsmakers and the public like the Texans, Giants, and Browns more than the models do. That makes sense given that the models often look to last season as a baseline, when the Texans were injured, the Giants were bad, and the Browns were horrific. We'll see how things shake out in Week 2. Baltimore already lost at Cincinnati on Thursday night. Top five value plays were 4-1 in Week 1 (+390). LAST WEEK: 4-1 (+290) 65%+ COVERS: 2-0 (+200) 60%+ COVERS: 2-1-1 (+80)
II. Money Line — Top 5 Value in Week 2
1. Arizona: +750 at L.A. Rams — 23% chance to win 2. Tennessee: +145 vs. Houston — 62% chance to win 3. Buffalo: +280 vs. L.A. Chargers — 38% chance to win 4. Kansas City: +215 at Pittsburgh — 41% chance to win 5. Oakland: +240 at Denver — 38% chance to win These plays went 2-3 in Week 1, but because the list included underdogs (mostly heavy underdogs), that sub-.500 outcome would have generated meaningful profit. The Jets won as +250 underdogs at Detroit and the Bucs won as +375 underdogs at New Orleans. The Bears almost won (+260) at Green Bay, too. The plays listed here each week will almost certainly be underdogs. That's because the models think certain games are a bit more balanced than high moneyline odds imply. Check out Arizona for example. At +750, the odds suggest that the Cardinals have a 12% chance to win at the Rams, whereas the models suggest a 23% chance. A 23% chance to win $750 on a $100 wager equates to an expected return of $95.5. LAST WEEK: 2-3 (+325)
III. Searching for Value in NFL Futures Bets
When reviewing the table below, remember that the expected values listed are only as good as your faith in the probabilities that produce them. For example, if you think Washington really has a 3.0% chance to win the Super Bowl, then there is good value to be had at +5000 (50 to 1). But if you instead think Washington has a 2.0% chance at the Lombardi Trophy, you should view them as fairly priced at +5000. All this really does is compare the models' average probability of a certain event to the probability implied by Westgate's current odds. When the models' average probability is higher than the odds-implied probability, the expected value (or return on your wager) will be positive. There are very few such bets. Good value doesn't mean an event is likely. It just means you think it's more likely than the odds suggest. After last week's performance, the models believe the Jets have a 20% to win the AFC East, whereas New York's +1000 odds suggest a 9% chance. Value? Depends what you believe. Same logic for everything else.
Note: Westgate did not have NFC North odds or a Vikings-Packers line as of September 15. I used 5dimes for those this week instead.
The primary data sources for this article were the Westgate Las Vegas SuperBook (odds as of September 15), ESPN Football Power Index, Football Outsiders, Massey-Peabody Analytics, and The Prediction Tracker. Data was compiled and analyzed by ELDORADO. All charts and graphics herein were created by ELDORADO.
The original version of this article framed expected value in terms of what a hypothetical $100 wager "would turn into." For example, if you were expected to lose $10, I showed the resulting expected value as $90, or $10 less than $100. I've since updated this to show the "expected return" on that $100 wager. So in that same example, the expected value now shows as negative $10. This is much more intuitive — positive expected values are good, and negative expected values are bad.
0 Comments
Leave a Reply. |
|


 RSS Feed