NEW: The Dome Effect Is A Myth
A shorter, sweeter, up-do-date review
VIDEO: The Dome Effect Is A Myth
Released March 29 on YouTube!
A shorter, sweeter, up-do-date review
VIDEO: The Dome Effect Is A Myth
Released March 29 on YouTube!
Is College Basketball's 'Dome Effect' Real?
Do NCAA Tournament Teams Shoot Poorly in Big Domed Football Stadiums?
MAR 16 2016
Part I - Part II - Part III - Part IV - Part V
Do NCAA Tournament Teams Shoot Poorly in Big Domed Football Stadiums?
MAR 16 2016
Part I - Part II - Part III - Part IV - Part V
I wrote a condensed version of this for FiveThirtyEight: The Dome Effect Isn't Real; The NRG Effect Is Complicated
IV. Team offense and opponent defense matter - venue type does not
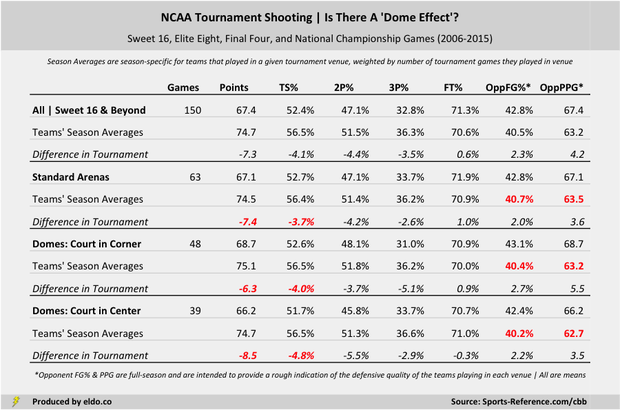
Teams shoot slightly worse and score less in dome-centers than in other venues, but they also play against better defenses. The average defense playing in a standard arena has a full-season opponent field goal percentage (OppFG%) of 40.7% and a points-against average of 63.5 points. This compares to 40.4% and 63.2 in dome-corners and 40.2% and 62.5 in dome-centers (highlighted in red below).
Teams shoot slightly worse and score less in dome-centers than in other venues, but they also play against better defenses. The average defense playing in a standard arena has a full-season opponent field goal percentage (OppFG%) of 40.7% and a points-against average of 63.5 points. This compares to 40.4% and 63.2 in dome-corners and 40.2% and 62.5 in dome-centers (highlighted in red below).
|
|
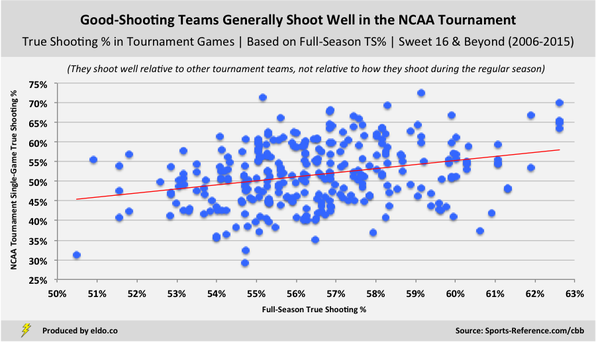
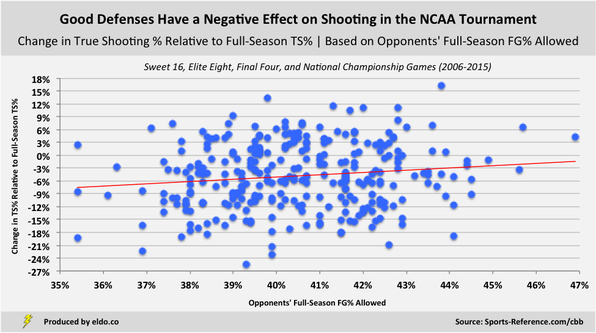
Statistically, it's no coincidence (or surprise) that teams shoot worse and score less against better defenses. When considering a team’s true shooting percentage (TS%) in a late-round NCAA tournament game, their full-season TS% and the other team’s full-season OppFG% are significant[1]. When considering a team’s change in TS% in a late-round NCAA tournament game relative to their season average, the other team’s full-season OppFG% is significant[2].
Statistically, it's no coincidence (or surprise) that teams shoot worse and score less against better defenses. When considering a team’s true shooting percentage (TS%) in a late-round NCAA tournament game, their full-season TS% and the other team’s full-season OppFG% are significant[1]. When considering a team’s change in TS% in a late-round NCAA tournament game relative to their season average, the other team’s full-season OppFG% is significant[2].
|
|
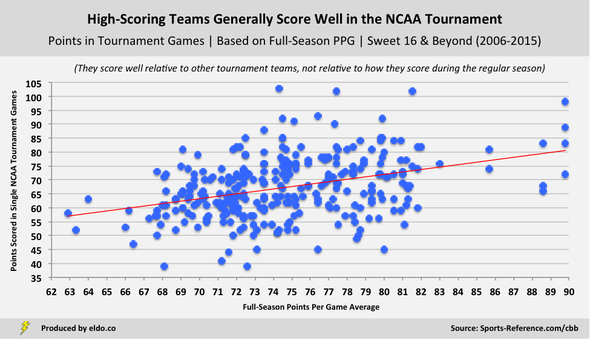
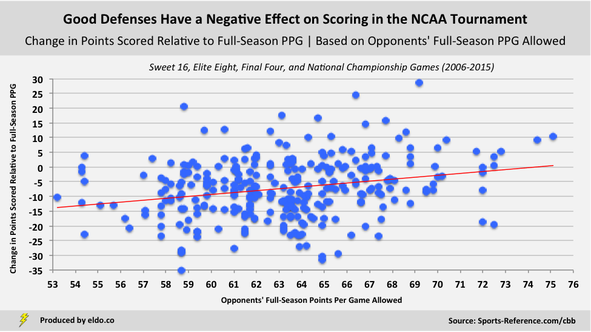
Likewise, when considering a team’s point total in a late-round NCAA tournament game, their full-season points per game (PPG) average and the other team’s full-season PPG allowed are significant[3]. When considering a team’s change in point total in a late-round NCAA tournament game relative to their season average, the other team’s full-season PPG allowed is significant[4].
Note that while the aforementioned variables and trends are significant, the data is noisy and highly variable around that trend. None of the models I've run explain much of the variance around the trend or offer much in the way of predictive power. They simply indicate that real relationships exist, which is more than can be said of venue type. We've gone down a few rabbit holes, controlled for a bunch of factors, and will keep exploring throughout March Madness, but venue type does not appear to have a statistically significant effect on shooting or scoring in the NCAA tournament.
Next: What about specific venues and this year's Final Four at NRG Stadium?
Next: What about specific venues and this year's Final Four at NRG Stadium?
I. Introduction
II. How do teams perform in different NCAA tournament venue types?
III. How does that performance compare to their season averages?
IV. Team offense and opponent defense matter - venue type does not
V. What about specific venues and this year's Final Four at NRG Stadium?
II. How do teams perform in different NCAA tournament venue types?
III. How does that performance compare to their season averages?
IV. Team offense and opponent defense matter - venue type does not
V. What about specific venues and this year's Final Four at NRG Stadium?
|
|
Methodology
This analysis uses True Shooting % and average performance, weighting each game equally regardless of how many shots were taken. For FiveThirtyEight and my 2017 update, I used Effective FG% and aggregate performance, calculating shooting percentages based on all shots taken and made (shots equally weighted). The takeaways are the same with either methodology. See Part V for a postscript on further reading, overtime, defensive metrics, and how I calculated changes in performance relative to teams' season averages.
This analysis uses True Shooting % and average performance, weighting each game equally regardless of how many shots were taken. For FiveThirtyEight and my 2017 update, I used Effective FG% and aggregate performance, calculating shooting percentages based on all shots taken and made (shots equally weighted). The takeaways are the same with either methodology. See Part V for a postscript on further reading, overtime, defensive metrics, and how I calculated changes in performance relative to teams' season averages.
Footnotes
[1] p = 0.0000 with p = 0.0000 for team's full-season true shooting percentage and p = 0.0178 for opposing defense's full-season field goal percentage allowed. Note that correlated variables such as full-season TS% and PPG can be swapped and significance still holds
[2] p = 0.0175 for opposing defense's full-season field goal percentage allowed
[3] p = 0.0000 with p = 0.0000 for team's full-season points per game average and p = 0.0000 for opposing defense's full-season points per game allowed. Note that correlated variables such as full-season PPG and TS% can be swapped and significance still holds
[4] p = 0.0000 for opposing defenses's full-season points per game allowed
The data source for this article is sports-reference.com/cbb. Data was compiled and analyzed by ELDORADO. All charts and graphics herein were created by ELDORADO.
ELDORADO | Berkeley, CA | New York, NY
eldo.co | @eldo_co
ELDORADO | Berkeley, CA | New York, NY
eldo.co | @eldo_co
