NEW: The Dome Effect Is A Myth
Updated and adapted for 2018
VIDEO: The Dome Effect Is A Myth
Released March 29 on YouTube!
Updated and adapted for 2018
VIDEO: The Dome Effect Is A Myth
Released March 29 on YouTube!
Reminder: College Basketball's Dome Effect Is A Myth
Teams shoot fine in newfangled domes – especially from long range
MAR 3 2017
Updates: 2018 - 2017
Is College Basketball's Dome Effect Real? (2016)
Teams shoot fine in newfangled domes – especially from long range
MAR 3 2017
Updates: 2018 - 2017
Is College Basketball's Dome Effect Real? (2016)
I wrote a points-focused spinoff for Nylon Calculus: Teams score less in domes — but not for the reasons you think
This time last year, I wrote a five-part study on college basketball’s dome effect on ELDORADO and an article on it for FiveThirtyEight. I’m back this year with updated numbers (through 2016), a quicker read (I hope), and a reminder that the dome effect isn’t real.
The 1996 Final Four at Continental Airlines Arena in New Jersey was the last one held in a basketball arena. National championship game attendance that year was 19,229. From 1997 through 2008[1], Final Fours were played in domed stadiums with the court laid in one corner or end zone. This “traditional dome” configuration allowed for crowds of 50,000-plus.
The 1996 Final Four at Continental Airlines Arena in New Jersey was the last one held in a basketball arena. National championship game attendance that year was 19,229. From 1997 through 2008[1], Final Fours were played in domed stadiums with the court laid in one corner or end zone. This “traditional dome” configuration allowed for crowds of 50,000-plus.
|
|
Starting with two regionals in 2008[2] and the Final Four in 2009, the NCAA moved the court to midfield. The new setup enabled 70,000-plus fans to attend the tournament’s biggest games. But it also created rampant speculation that distant and unfamiliar backdrops behind each hoop were negatively impacting shooting, particularly three-point shooting. The phenomenon was dubbed the “dome effect”.
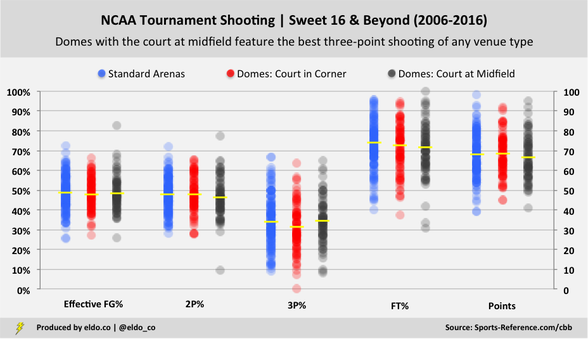
Most dome-effect conversation relied on anecdote or evidence from only a couple of NCAA tournaments. So I reviewed every Sweet 16, Elite Eight, Final Four, and national championship game since 2006 – a total of 330 team performances in 165 games[3]. Contrary to popular belief, teams shoot threes better in domes with the court at midfield than anywhere else[4]:
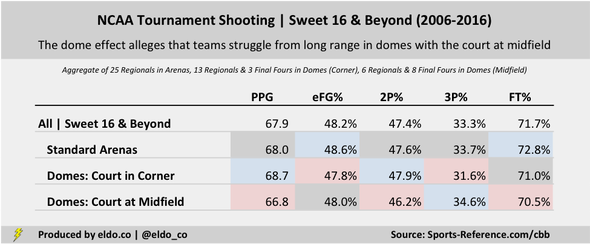
Aggregate performance | Points exclude overtime
3P% standard deviation is also lowest in domes-midfield
|
|
But wait a second – the court-at-midfield setup is used in later rounds, with better teams, so couldn't those teams simply be better at three-point shooting to begin with? To account for that, I measured team performance relative to their season averages. This helps isolate the *possible effects* of venue type on shooting. Our observations hold up – newfangled domes are not the villain when it comes to threes:
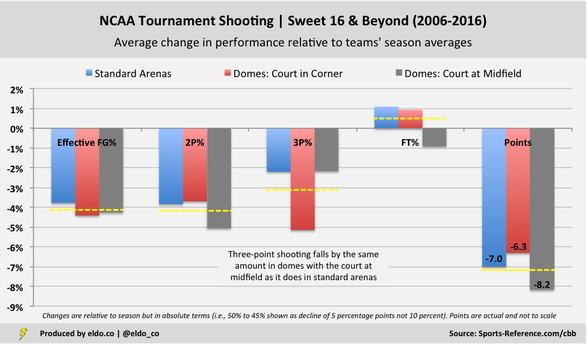
Notice everything but free throws falls relative to the regular season? That's to be expected – teams in late-round NCAA tournament games are up against top competition. If we looked at court-at-midfield shooting in isolation – without comparing it to other venue types – we would run the risk of saying, "wow, 34.6% on threes is terrible". As a regular-season percentage it would rank 190th in Division I after all. But in the later rounds of the tournament, three-point shooting percentage declines across all venue types.
On average, three-point shooting percentage falls by almost exactly the same amount in football stadiums with the court atop the 50-yard line as it does in regular old basketball arenas. The setup most deserving of three-point suspicion is the traditional dome with the court in one corner or end zone.
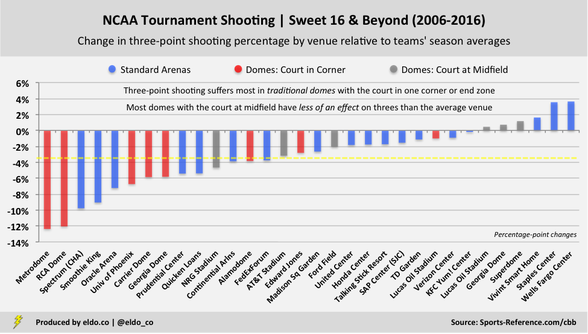
A look at individual venues only furthers the notion that the dome effect is a myth. Five of the six venues that have used the court-at-midfield setup have had less of an effect on threes than the average regional or Final Four venue since 2006. (This year’s Final Four venue, University of Phoenix Stadium, has never used the court-at-midfield setup in the NCAA tournament; it’s been below average as a traditional dome.)
On average, three-point shooting percentage falls by almost exactly the same amount in football stadiums with the court atop the 50-yard line as it does in regular old basketball arenas. The setup most deserving of three-point suspicion is the traditional dome with the court in one corner or end zone.
A look at individual venues only furthers the notion that the dome effect is a myth. Five of the six venues that have used the court-at-midfield setup have had less of an effect on threes than the average regional or Final Four venue since 2006. (This year’s Final Four venue, University of Phoenix Stadium, has never used the court-at-midfield setup in the NCAA tournament; it’s been below average as a traditional dome.)
Click here for change in eFG% by venue
|
|
Statistical testing confirms that venue type does not have a meaningful effect on shooting or scoring in the NCAA tournament. What does? Not surprisingly, team offense and opponent defense – as measured by full-season performance – are the statistically significant variables at play in later rounds. You can even map teams' offensive performance by venue type to the overall quality of the defenses they're up against[5]:
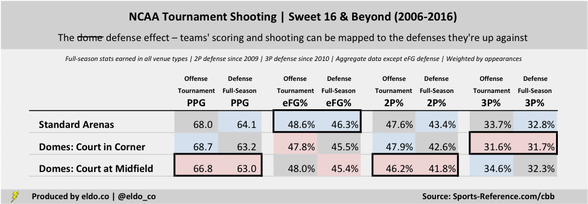
Tournament points exclude overtime
Tournament teams in domes-midfield score 1.2 fewer points per game than those in standard arenas – well the defenses they opposed allowed 1.1 fewer points per game over the course of the season than those playing in standard arenas. Teams in arenas shoot best overall – they faced the softest defenses. Teams in domes-midfield stink from two – they played the best interior defenses. Teams in domes-corner stink from three – they saw the best perimeter defenses.
If you don't believe the numbers, check out Villanova's brilliant shooting display in last year's Final Four. And if you don't think we should draw conclusions based on one or two memorable games, then none of us should have believed in the dome effect in the first place.
If you don't believe the numbers, check out Villanova's brilliant shooting display in last year's Final Four. And if you don't think we should draw conclusions based on one or two memorable games, then none of us should have believed in the dome effect in the first place.

|
|
Methodology
This analysis uses Effective FG% and aggregate performance, adding up all shots taken and made and calculating shooting percentages (shots equally weighted). This is the same methodology I used last year for FiveThirtyEight. My original five-party study used True Shooting % and average performance, weighting each game equally regardless of how many shots were taken. The takeaways are the same with either methodology.
This analysis uses Effective FG% and aggregate performance, adding up all shots taken and made and calculating shooting percentages (shots equally weighted). This is the same methodology I used last year for FiveThirtyEight. My original five-party study used True Shooting % and average performance, weighting each game equally regardless of how many shots were taken. The takeaways are the same with either methodology.
Footnotes
[1] The traditional-dome setup was also occasionally used at a handful of Final Four venues prior to 1997.
[2] The modern version of the dome-with-the-court-at-the-50-yard-line debuted at the 2008 Midwest Regional in Detroit (Ford Field) and 2008 South Regional in Houston (Reliant Stadium, now NRG Stadium). The setup was previously used in some regular-season games and a variation without seats around the court was used for UCLA-Houston at the Astrodome in 1968 (the Game of the Century), also a regular-season game. The 1971 Final Four at the Astrodome offered a somewhat similar court-in-the-middle-of-a-baseball-diamond configuration.
[3] Seventy-five games (150 team performances) in standard arenas, 48 games (96 team performances) in traditional domes with the court in one corner or end zone, and 42 games (84 team performances) in domes with the court at midfield. Sample size is still pretty small.
[4] Domes with the court at midfield featured the best three-point percentage of any venue type heading into last year's NCAA tournament too – so as great as Villanova was in 2016, the Wildcats' performances did not all of a sudden change the paradigm. Domes-midfield performance ticked up a little thanks to last year – 0.5 to 0.6 percentage points, enough to sneak past traditional domes in terms of effective field-goal percentage – but standard arenas actually saw slightly greater gains.
[5] These relationships are statistically significant but do not offer much in the way of predictive power. Two-point defense data is only available since 2009 and three-point defense data is only available since 2010, which creates a little bit of a mismatch in time periods relative to the offensive performances in the NCAA tournament to which they're compared in the chart above. Because three-point defense data is only available since 2010, there is not enough information to calculate an aggregate effective field-goal percentage allowed for the entire period. The effective field-goal percentage defense presented above is thus calculated based on the average number of field goals taken and made over the course of the full season against the defenses playing in each venue since 2006 and the average number of three-pointers made against them since 2010. See last year's postscript for more info on how I calculated teams' full-season averages. The main thing to know there is that they're appropriately weighted by teams' appearances in each venue type.
The data source for this article is sports-reference.com/cbb. Data was compiled and analyzed by ELDORADO. All charts and graphics herein were created by ELDORADO.
ELDORADO | Berkeley, CA | New York, NY
eldo.co | @eldo_co
ELDORADO | Berkeley, CA | New York, NY
eldo.co | @eldo_co
