NEW: The Dome Effect Is A Myth
A shorter, sweeter, up-do-date review
VIDEO: The Dome Effect Is A Myth
Released March 29 on YouTube!
A shorter, sweeter, up-do-date review
VIDEO: The Dome Effect Is A Myth
Released March 29 on YouTube!
Is College Basketball's 'Dome Effect' Real?
Do NCAA Tournament Teams Shoot Poorly in Big Domed Football Stadiums?
MAR 16 2016
Part I - Part II - Part III - Part IV - Part V
Do NCAA Tournament Teams Shoot Poorly in Big Domed Football Stadiums?
MAR 16 2016
Part I - Part II - Part III - Part IV - Part V
I wrote a condensed version of this for FiveThirtyEight: The Dome Effect Isn't Real; The NRG Effect Is Complicated
II. How do teams perform in different NCAA tournament venue types?
I analyzed every NCAA tournament game from the regional semifinals (Sweet 16) through the national championship over the past ten years (2006-2015) – a total of 300 team performances in 150 games. The games have been played in three venue types.
Traditional basketball or hockey arenas (“standard arenas”) continue to host early round games (not part of this study), regional semifinals (Sweet 16), and regional finals (Elite Eight). Domed stadiums with the court in an end zone (“domes: court in corner”, “dome-corners”, or "traditional domes") hosted the Final Four through 2008 and continue to host some regionals (none this year). Domed stadiums with the court at the 50-yard line (“domes: court in center”, “dome-centers”, "open domes", or “bowls”) host some regionals (none this year) and continue to host the Final Four.
Most discussion of the dome effect refers specifically to the dome-center configuration and not the dome-corner setup, so it's important we treat them as distinct. Here’s how teams have performed in each of the three settings over the past ten years.
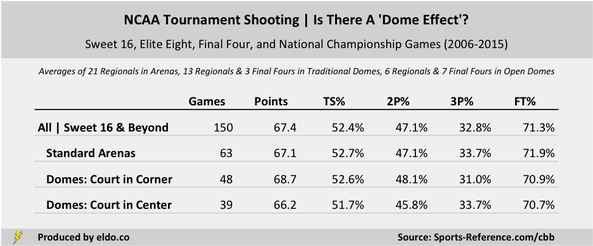
Average performance (games equally weighted)
|
|
The dome effect has long been viewed by way of anecdote and ad hoc analysis, which has made it tough to nail down. On top that, dome-center games are often played later in the tournament, amidst higher stakes, with better offenses, and against better defenses (which we’ll address shortly). And while these summary results might be helpful to see, they don't quite clear the air.
On average, NCAA tournament teams score less and shoot worse on two-point field goals (2P%) and free throws (FT%) in domes with the court in the center. But three-pointers (3P%) – often at the heart of the new open-bowl dome effect critique – are converted at a lower rate in traditional dome-corner setups. In fact, teams shoot threes as well in domes with the court at midfield as they do in standard arenas.
The average true shooting percentage (TS%) for a team playing in a dome-center is 1.0 percentage point worse than that of a team playing elsewhere. For a team that attempts 56 FGs and 19 FTs (late-round tournament averages), that’s the difference of about 1.25 points for an entire game[1]. If, instead of taking the average true shooting performance across all games, you add up all of the points scored, field goal attempts, and free throw attempts by venue and compute aggregate true shooting percentage for each, open domes are only 0.01 percentage points worse than standard arenas and traditional domes[2].
|
|
The next chart shows exactly how teams performed in each of the 150 Sweet 16, Elite Eight, Final Four, and National Championship games played in the past decade. It hopefully provides a better visual sense of the relatively low average 3P performance for teams playing in traditional domes (court in corner) and the relatively low median points scored by teams playing bowl-style domes (court in center), among other things.
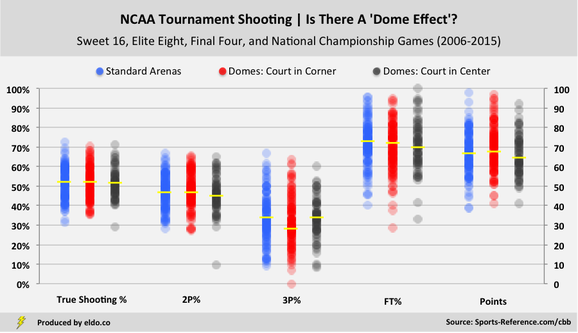
Even without labels, Butler's 2011 national championship true shooting percentage (29%), two-point field goal percentage (10%), and points (41) are easy to spot as the low gray outliers in each of those three categories. Interestingly, for all of the infamy surrounding Butler and speculation that shooting in bowls is a crapshoot, standard deviation is lowest for true shooting percentage in big domes with the court at midfield[3].
And while no team has shot quite as poorly as Butler did on that fateful night, arenas and traditional dome-corners have played host to their own shooting disasters and newfangled dome-centers have played host to shooting excellence (albeit less so with threes, even with the high median). But we don't really remember them or attribute those examples to stadiums or venues because that's not what we're looking for. We attribute those to other narratives, like Kentucky's athleticism or Syracuse's two-three zone (which are likely more correct).
Next: How does performance by venue type compare to teams' season averages?
I. Introduction
II. How do teams perform in different NCAA tournament venue types?
III. How does that performance compare to their season averages?
IV. Team offense and opponent defense matter - venue type does not
V. What about specific venues and this year's Final Four at NRG Stadium?
II. How do teams perform in different NCAA tournament venue types?
III. How does that performance compare to their season averages?
IV. Team offense and opponent defense matter - venue type does not
V. What about specific venues and this year's Final Four at NRG Stadium?
|
|
Methodology
This analysis uses True Shooting % and average performance, weighting each game equally regardless of how many shots were taken. For FiveThirtyEight and my 2017 update, I used Effective FG% and aggregate performance, calculating shooting percentages based on all shots taken and made (shots equally weighted). The takeaways are the same with either methodology. See Part V for a postscript on further reading, overtime, defensive metrics, and how I calculated changes in performance relative to teams' season averages.
This analysis uses True Shooting % and average performance, weighting each game equally regardless of how many shots were taken. For FiveThirtyEight and my 2017 update, I used Effective FG% and aggregate performance, calculating shooting percentages based on all shots taken and made (shots equally weighted). The takeaways are the same with either methodology. See Part V for a postscript on further reading, overtime, defensive metrics, and how I calculated changes in performance relative to teams' season averages.
Footnotes
[1] Median field goal attempts is 56 and median free throw attempts is 19 across all teams, games, and venues in the Sweet 16, Elite Eight, Final Four, and National Championship over the past ten years.
[2] 51.27% in standard arenas, 51.44% in traditional domes, and 51.33% in open domes. Computing true shooting percentage in the aggregate effectively serves to treat each individual shot as equal, whereas taking team averages across all games treats each team performance as equal.
[3] Standard deviation is also lowest for 3P% in dome-centers, but that's due in large part to an absence of really good performances. TS% standard deviations are 8.1% for arenas, 8.2% for dome-corners, and 7.2% for dome-centers.
The data source for this article is sports-reference.com/cbb. Data was compiled and analyzed by ELDORADO. All charts and graphics herein were created by ELDORADO.
ELDORADO | Berkeley, CA | New York, NY
eldo.co | @eldo_co
ELDORADO | Berkeley, CA | New York, NY
eldo.co | @eldo_co
