NEW: The Dome Effect Is A Myth
A shorter, sweeter, up-do-date review
VIDEO: The Dome Effect Is A Myth
Released March 29 on YouTube!
A shorter, sweeter, up-do-date review
VIDEO: The Dome Effect Is A Myth
Released March 29 on YouTube!
Is College Basketball's 'Dome Effect' Real?
Do NCAA Tournament Teams Shoot Poorly in Big Domed Football Stadiums?
MAR 16 2016
Part I - Part II - Part III - Part IV - Part V
Do NCAA Tournament Teams Shoot Poorly in Big Domed Football Stadiums?
MAR 16 2016
Part I - Part II - Part III - Part IV - Part V
I wrote a condensed version of this for FiveThirtyEight: The Dome Effect Isn't Real; The NRG Effect Is Complicated
V. The dome effect isn't real; the NRG effect is complicated
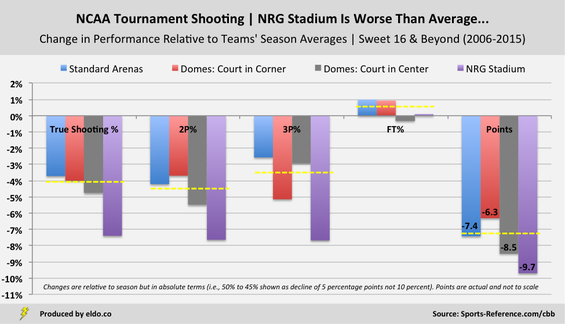
This March Madness, all four regionals will be held in basketball arenas – the United Center in Chicago, Wells Fargo Center in Philadelphia, KFC Yum! Center in Louisville, and Honda Center in Anaheim – so we likely won’t hear any speculation about their effect on shooting. But the 2016 Final Four will be held at NRG Stadium in Houston, the poster child for the dome effect. Here’s how teams have fared at NRG Stadium and other dome-center setups.
This March Madness, all four regionals will be held in basketball arenas – the United Center in Chicago, Wells Fargo Center in Philadelphia, KFC Yum! Center in Louisville, and Honda Center in Anaheim – so we likely won’t hear any speculation about their effect on shooting. But the 2016 Final Four will be held at NRG Stadium in Houston, the poster child for the dome effect. Here’s how teams have fared at NRG Stadium and other dome-center setups.

Average performance (games equally weighted). See aggregate
In line with its reputation, NRG Stadium has produced lower-than-average scoring and worse-than-average shooting (particularly 3P%), both in general and among other bowls. The stadium has likewise had a “worse than average” effect on teams relative to their full-season performance.
Defenses at NRG have been something of a mixed bag – tough against the shot and middle of the pack in terms of points allowed. Meanwhile, other open domes – AT&T Stadium, Lucas Oil Stadium, and the Georgia Dome – have, on average, yielded good or very good shooting performances.
Defenses at NRG have been something of a mixed bag – tough against the shot and middle of the pack in terms of points allowed. Meanwhile, other open domes – AT&T Stadium, Lucas Oil Stadium, and the Georgia Dome – have, on average, yielded good or very good shooting performances.
|
|
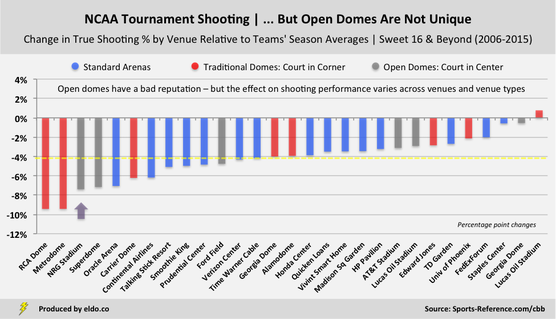
Daunting as it may seem, the NRG effect is not so cut and dried. The stadium’s impact on three-point shooting is worst among open domes but ranks only fifth worst among the 29 venues that hosted the regionals or Final Four in the past ten years – behind two arenas and two traditional domes. Its impact on true shooting percentage is worst among open domes and third worst overall behind the Metrodome in Minneapolis and old RCA Dome in Indianapolis.
Across venues, NRG stadium has a statistically significant effect on two-point field goals and true shooting percentage, but not on threes[1]. NRG’s impact on threes is only significant when compared to other open domes – all of which turn out to be pretty good places to shoot from long range. For now, Final Fours are played exclusively in open domes, so while the NRG effect on threes doesn't quite maintain its statistical significance across all venues, being unique among open domes still matters.

Average performance (games equally weighted)
Of everything we've looked at, these final two charts and the old eye test might summarize things best. The blue (standard arenas), red (traditional domes with the court in corner), and gray (bowl-style domes with the court at midfield) are scattered randomly and evenly throughout the chart. There's nothing really special about big, open-bowl domes - two are worse than average, one is about average, and three are better than average. NRG Stadium is the worst of the bowls, but bowls are not the worst of the lot. We'll keep chasing these ghosts throughout March Madness, but for now it seems the dome effect is more phantom than fact.

|
|
Addendum on Three-Point Shooting
These are the same charts as above, reproduced to focus specifically on three-point shots. The results do even more to dispel the notion of an open-dome effect. Five of the six open-dome venues have had less of an effect on teams' three-point shooting than the average Sweet 16, Elite Eight, Final Four or National Championship venue in the past ten years. In three of the open domes, teams have shot threes better than they did for the entire season – a rarity for the late rounds of the NCAA tournament.
NRG Stadium boasts the eighth-lowest average three-point percentage of twenty-nine venue setups. When we factor in the full-season three-point shooting ability of the teams playing in NRG Stadium, we see that it has the fifth-worst effect on teams shooting threes relative to their season averages. All of the venues worse than NRG Stadium are standard arenas and traditional domes, with the red of the traditional domes skewing left in both charts, reinforcing the fact that traditional domes – not open domes – have been most unfriendly to three-point shooters.
(As noted earlier, NRG Stadium has a statistically significant effect on teams' changes in three-point percentage relative to their season averages - but only relative to other open domes, not relative to all venues or venue types.)


Average performance (games equally weighted). See aggregate
|
|
Methodology
This analysis uses True Shooting % and average performance, weighting each game equally regardless of how many shots were taken. For FiveThirtyEight and my 2017 update, I used Effective FG% and aggregate performance, calculating shooting percentages based on all shots taken and made (shots equally weighted). The takeaways are the same with either methodology. See Part V for a postscript on further reading, overtime, defensive metrics, and how I calculated changes in performance relative to teams' season averages.
This analysis uses True Shooting % and average performance, weighting each game equally regardless of how many shots were taken. For FiveThirtyEight and my 2017 update, I used Effective FG% and aggregate performance, calculating shooting percentages based on all shots taken and made (shots equally weighted). The takeaways are the same with either methodology. See Part V for a postscript on further reading, overtime, defensive metrics, and how I calculated changes in performance relative to teams' season averages.
Postscript on further reading, overtime, opponents' FG%, data availability, changes in performance, and teams' season averages
Further Reading: College basketball stats pioneer Ken Pomeroy has explored the dome effect on three-point shooting, more broadly considering how background might affect long-distance shots, and the NRG effect, considering how NRG Stadium might specifically affect three-point shooting. There are other interesting musings and small-sample snapshots on the topic. My intention here is to extend, complement, and crystallize what has to this point been a tough phenomenon to pin down. This analysis focuses on the NCAA tournament, but regular season games are played in domes too - more commonly in dome-corners (Syracuse plays their home games in the Carrier Dome) and once in a while in dome-centers. So the potential sample is larger than we've focused on here and the impact of these findings are ripe for further testing and possible applicability beyond the NCAA tournament.
Overtime: I used end-of-regulation scores for all NCAA tournament games that went to overtime to neutralize the effects the extra scoring would have on points scored and allowed.
Opponents' FG% & Data Availability: When approximating defensive quality, I used opponents' field goal percentage (OppFG%) - rather than, say, opponents' true field goal percentage - based on availability of data. Sports Reference publishes opponents' FGA back to 2009 and opponents' FTA back to 2010. Both are required to calculate TS%, and this study extends back to 2006, so I had to lean on the "simpler" OppFGA% to provide a rough indication for defensive quality. Other advanced metrics such as Offensive Rating (ORtg) and Defensive Rating (DRtg) go back to 2010 (on Sports Reference). I will keep exploring and will take a deeper look at the past five to six years. The sample size is smaller but there are more advanced metrics available in the nearer-term.
Changes in Performance: When presenting changes in performance relative to teams' season averages, I show the data in absolute terms (i.e., percentage-point changes rather than percent changes). In other words - and as noted in certain locations - "changes are relative to season averages but are shown in absolute terms (i.e., 50% to 45% is shown as a decline of 5% rather than 10%)". Presenting those changes in relative terms (i.e., showing a decline from 50% to 45% as a 10% drop) is technically more informative in that it accounts for the different starting points of each team (in this case their full-season averages). However, I found that presenting the data in that manner was less intuitive to readers, largely due to the fact that the performance metrics we're dealing in are already percentages themselves. It's easier to think "A team shot 50% during the season and 45% during the NCAA tournament, so their shooting percentage fell by 5 percentage points" than it is to think "A team shot 50% during the season and 45% during the NCAA tournament, so their shooting percentage fell by 10 percent". I cross-checked the two and the results are very similar (given that teams' season averages are clustered and range-bound). So I'll stick with this way for now.
Teams' Season Averages: I calculated changes in team performance by venue and venue type relative to teams' season averages. Teams' season averages were "season-specific for teams that played in a given tournament venue, weighted by the number of games that team played in the venue". Let's explain what that means using the Superdome as an example. The Superdome hosted the 2012 Final Four, which included three games (two Final Four and one national championship). Average team performance in the Superdome in the 2012 Final Four thus included six single-game performances. The "teams' season averages" to which we compare this performance includes Louisville's full-season 2011-2012 results (one part), Ohio State's full-season 2011-2012 results (one part), Kansas's full-season 2011-2012 results (two parts), and Kentucky's full-season 2011-2012 results (two parts), given that Kansas and Kentucky advanced and each played twice in the venue. In order words, the teams' season averages that I use as a basis for comparison mirror the constitution of the teams that played the games in the venue. And they look only at the specific season at hand.
Footnotes
[1] If you remove Butler's 2011 NCAA championship game performance, NRG loses its statistical significance across all venues for change in 2P% (by a decent amount) and TS% (by a little bit). I've heard both sides of the argument as to whether that game should or should not be included. On one hand, it's an extreme outlier in terms of 2P% - Butler shot 3 of 31 on two-point attempts in the game (9.7%), 4.5 standard deviations below the mean for the Sweet 16 and later (2006-2015). On the other hand, Butler's true shooting percentage in the game is "only" 3.0 standard deviations below its mean, and it isn't far off a few other true shooting results from other teams in the tournament. On top of all of that, the performance happened, it's a reasonable (if extreme) part of our subject matter, and it's not the product or error, misreporting, or unique circumstances.
Therein lies some of the complexity of the NRG effect. It has a significant effect on 2P% and TS%, but that effect goes away if you eliminate the Butler result. It has a significant effect on 3P%, but only relative to other open domes, which isn't super compelling but still matters because open domes are the only venues that host Final Fours. Our sample sizes are still relatively small, but as of right now I think we know enough to know that the dome effect isn't real and the NRG effect is complicated.
The data source for this article is sports-reference.com/cbb. Data was compiled and analyzed by ELDORADO. All charts and graphics herein were created by ELDORADO.
ELDORADO | Berkeley, CA | New York, NY
eldo.co | @eldo_co
ELDORADO | Berkeley, CA | New York, NY
eldo.co | @eldo_co
