The 2016 San Francisco 49ers finished with the third-worst run defense in NFL history
JAN 12 2017
Final (Full Season) - Original (Thru Week 10)
JAN 12 2017
Final (Full Season) - Original (Thru Week 10)
Nearly four years ago, the San Francisco 49ers came a few yards short of a Lombardi Trophy. Today they are a franchise in disarray, fresh off a 2-14 season, second-worst in the NFL. They have an unpopular $1.3 billion stadium, unwanted ownership, an unhappy fan base, and no coach or general manager.
The Niners new coach – whoever it is – will be tasked with turning around both the second-worst offense and single-worst defense in the NFL. Much was made of that defense throughout the season, especially when it allowed a record seven-straight 100-yard rushers. But let's take a deeper look at how truly and historically bad the 49ers rushing defense was.
The Niners new coach – whoever it is – will be tasked with turning around both the second-worst offense and single-worst defense in the NFL. Much was made of that defense throughout the season, especially when it allowed a record seven-straight 100-yard rushers. But let's take a deeper look at how truly and historically bad the 49ers rushing defense was.
|
|
In allowing 166 rushing yards per game to opposing teams, the 2016 49ers finished with the 106th-worst yards-per-game-against mark of 1,929 teams since 1933[1]. That’s fifth-percentile bad and sixth-worst since 1990 – pretty bad, but probably not worth a whole story.
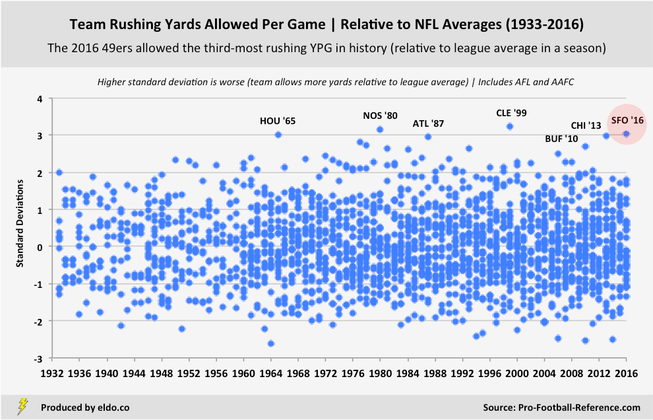
What makes those marks special is the fact that they came in an era when teams don’t run the ball all that much. 2016 had the fewest rushing attempts (26) and sixth-fewest rushing yards per team game (109) since 1933. Viewed in seasonal context – that is, measured relative to league rushing yards-against averages in a season[2] – the 2016 49ers had the third-worst run defense of all-time[3].
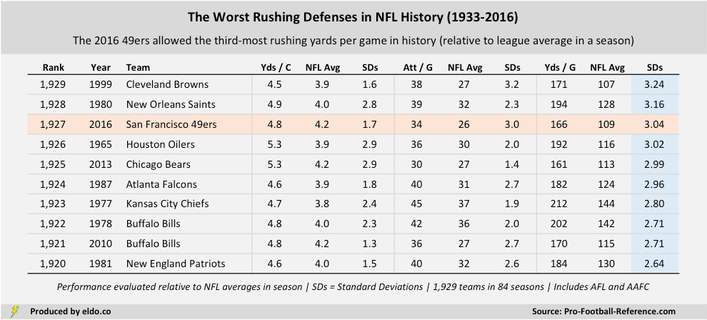
The 166 rushing yards per game the 49ers allowed this season was 3.04 standard deviations above the league’s 109-yard average[4]. Only the 1999 Browns (2-14) and 1980 Saints (1-15) were worse against the run relative to the rest of the league in the seasons they played.
Check out the best rushing defenses in NFL history by the same measure
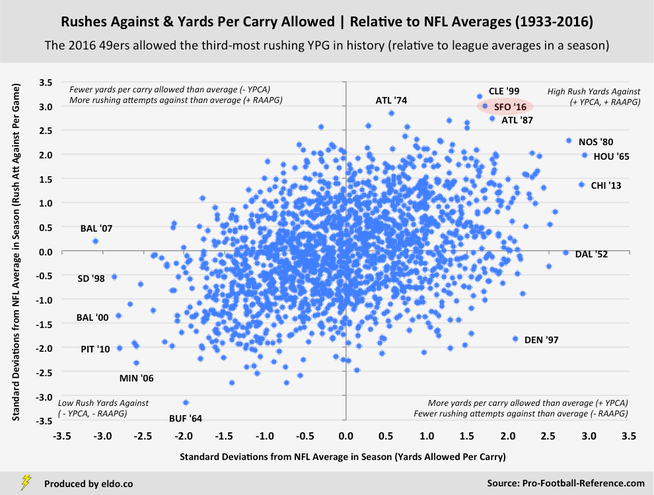
As always, historical feats (of excellence, ineptitude, or happenstance) require a special combination of circumstances. This season, the 49ers bequeathed 4.8 yards per carry to opposing rushers – 56th worst all-time in absolute terms and 80th worst relative to 2016's 4.2-yard average (1.7 standard deviations above the mean).
Their 34.3 rush attempts against per game are nothing to write home about in absolute terms – they're on par with league averages in parts of the run-heavy 1950s and 1970s and rank only 448th all-time. But they're 32% more than the typical team today (3.0 standard deviations above the mean). And they're the second biggest outlier in NFL history.
Their 34.3 rush attempts against per game are nothing to write home about in absolute terms – they're on par with league averages in parts of the run-heavy 1950s and 1970s and rank only 448th all-time. But they're 32% more than the typical team today (3.0 standard deviations above the mean). And they're the second biggest outlier in NFL history.
|
|
Key to that “special combination” was the Niners (now-former) head coach, Chip Kelly. Famous for his up-tempo offense – and perhaps now infamous for his conviction that ball control doesn’t matter – Kelly guided his Eagles (2013-2015) and Niners (2016) to the fastest offensive pace and lowest time of possession in all four seasons he coached in the pros[5].
Kelly’s 2013 and 2014 Eagles played fast and scored points (both went 10-6). But the Chip Kelly Experiment featured a mediocre offense in Philadelphia in 2015 and a terrible one in San Francisco in 2016. Without leads or the ball, the 2015 Eagles and 2016 Niners were punished on the ground. Both finished last in rushes against and rushing yards allowed. In this way, the 2016 49ers run defense was horrific in part because their offense played fast but sucked[6].
Under Jim Harbaugh, the 2011 49ers were 13th best in NFL history in rushing yards per game allowed relative to league average, putting them above the 99th percentile among the 1,929 teams since 1933. Five years later – and four years after that Super Bowl appearance – the Niners run defense is among the worst that ever played. To think how far they’ve fallen. And to think how close they came.
|
|
Footnotes
[1] 1933 is the earliest season for which pro-football-reference publishes opponents' rushing statistics. This analysis includes the American Football League (1960-1969) and All America Football Conference (1946-1949). References to "league history" or "NFL history" include these leagues and conferences.
[2] More specifically, measured relative to league average in a season in terms of standard deviations.
[3] We can quibble over the precise meaning of "worst". In this case, we are measuring ineptitude in terms of rushing yards per game allowed in a season relative to league averages in that season, expressed in standard deviations. Rushes against naturally plays a major role in this, and the 2016 49ers were run on a ton (along with allowing a lot of yards per carry). Looking purely at yards allowed per carry is a separate conversation (the 1965 Oilers, 2013 Bears, and 1980 Saints are the three worst all-time in terms of yards per carry allowed relative to league averages in a season). For those interested, we've taken a deep dive into the "yards per carry" versus "yards per game" topic before as it relates to individual running backs.
[4] Standard deviation of 18.8 yards per game.
[5] A cool study by James Keane of Bleeding Green Nation suggests that time of possession is of heightened importance when a bad defense plays a good offense (which makes sense, as it allows the inferior side to slow down the superior side). Kelly loved to brag about how little his Oregon teams possessed the ball, citing a 2012 game against UCLA in which Oregon won 60-13 despite being outpossessed 38:31 to 21:29. Kelly learned the hard way that his time-of-possession-be-damned logic doesn't hold up when your team is the inferior one.
[6] Which suggests that even without any personnel changes on defense, the 49ers run defense would allow fewer yards per game if their offense improves and/or holds the ball more.
The data source for this article is pro-football-reference.com. Regular season only. Includes AFL (1960-1969) and AAFC (1946-1949). Data was compiled and analyzed by ELDORADO. All charts and graphics herein were created by ELDORADO.
ELDORADO | Berkeley, CA | New York, NY
eldo.co | @eldo_co
ELDORADO | Berkeley, CA | New York, NY
eldo.co | @eldo_co


