Kobe Bryant Is the Second-Worst All-Star Starter in NBA Voting History - Behind Himself
But we don't need stats to know he's a star (and neither does Michael Rapaport)
JAN 3 2016 | UPDATED FEB 11
Voting & PER - Worst Starters - Voting & VORP - Biggest Snubs - Final Thoughts
But we don't need stats to know he's a star (and neither does Michael Rapaport)
JAN 3 2016 | UPDATED FEB 11
Voting & PER - Worst Starters - Voting & VORP - Biggest Snubs - Final Thoughts
II. Michael Rapaport & The Worst All-Star Starters in NBA Voting History
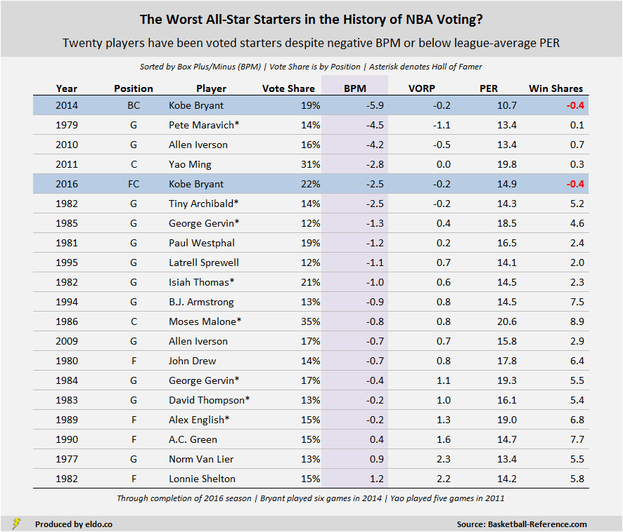
The question mark in the table above is no accident. Expressing NBA player performance by way of a single metric is riddled with complexity, and stardom and All-Star deservedness entail far more than statistics, let alone those from a single season.
In the words of Michael Rapaport, “What’s this new term, offensive efficiency? Where the fuck do they come up with this bullshit? What is this? Every year they come with a new stat […] What does that mean – no one knows what that – do you even know what that means? […] I’m watching basketball here eating chips.”
If you look back across the table, you’ll see that Rapaport has a point. In some cases, poor performance by one metric does not mean poor performance across them all. In 1982, Moses Malone was top fifteen in the NBA in PER and top twenty in Win Shares, yet his BPM that season was below average and is one of the twenty worst for a player voted to start an All-Star Game.
But whereas Moses’s 1982 is a mixed statistical bag, Kobe’s 2014 and 2016 are the worst or among the worst across all metrics. Among players voted to start, his 2014 is worst in PER and BPM and third worst in VORP. His 2016 was ultimately eleventh worst in PER, fifth worst in BPM, and third worst in VORP. Kobe 2014 and Kobe 2016 are the only two players in history voted to start the All-Star Game during a season in which they posted negative win shares.
Next: NBA All-Star Voting & Value Over Replacement Player (VORP)
|
|
Note: PER and BPM are rate statistics, so while Kobe's 2014 results in these categories are based on only six games - and Yao Ming's in 2011 are based on only five games - they are not cumulative statistics that would otherwise have been built over the course of a season. VORP, on the other hand, accumulates with minutes played over the course of a season. Note, however, that if Kobe continued to play in 2014 at a -5.9 BPM rate, he would have accumulated negative VORP, rendering his VORP total even worse than is represented above. Check out this glossary for more information on the terms and their respective pros and cons.
Vote share methodology and implications
“Positional vote shares” are the votes received by a player in a given season as a percent of the top tier votes at his position in that season. The “top tiers” are top five for centers (1975-2012); top ten for guards (1975-2012), forwards (1975-2012), and backcourt players (2013-2016); and top fifteen for frontcourt players (2013-2016).
This methodology normalizes votes across seasons and allows us to compare “how much of the vote” players received from year to year. It unfortunately leaves us blind to how much of the vote players outside of these top tiers might have received. It also subjects us to inconsistency in the size of the top tier for centers (1975-2012), which is why we broke them out for separate review. Frontcourt players’ vote share (2013-2016) is a little muted as it is calculated among the top fifteen vote getters.
From 1980-1985, the NBA only published the top five vote getters among guards and forwards. To translate this into a top ten equivalent, we used the average vote share obtained by players six through ten at each position in each conference in 1975, 1977, 1978, 1979, 1986, 1987, 1988, and 1989. From 1980-1981, the NBA only published the top three vote getters for centers, requiring translation into a top five equivalent. This and a couple of similar instances were addressed in a similar manner.
We would ideally present vote share as a percentage of all votes recorded in a given season, but it appears that the NBA only publishes results for the aforementioned top 5-10-15 recipients. If anyone is aware of – or has access to – the total number of votes by season, kindly let us know!
Notes
Players displayed as starters are those players who were voted to start the game by the fans, regardless of which player ultimately started (e.g., due to injury replacement).
Statistics are full-season except for the current NBA season, which is through February 10, 2016. Votes are, of course, cast during the first half of the season, without the knowledge or foresight of where a player's full-season stats will end up.
There was no All-Star Game in 1999. Magic Johnson was voted to start the 1992 NBA All-Star Game but did not play a regular season game that season. High PERs by way of only a few games – such as David Robinson’s 1997 – are omitted.
For more on advanced basketball statistics, check out this glossary (with examples, pros and cons) and/or this detailed explanation of BPM and VORP.
The data source for this article is basketball-reference.com. Data was compiled and analyzed by ELDORADO. All charts and graphics herein were created by ELDORADO.
ELDORADO | Berkeley, CA | New York, NY
eldo.co | @eldo_co
ELDORADO | Berkeley, CA | New York, NY
eldo.co | @eldo_co
