How Good Was O.J. Simpson at Football?
And other musings on rushing in the NFL
MAY 4 2016
Introduction - Analysis
Appendix I: Historical Trends and Stat Adjustment Considerations
Appendix II: The Best Runnings Backs and Rushing Seasons in NFL History
And other musings on rushing in the NFL
MAY 4 2016
Introduction - Analysis
Appendix I: Historical Trends and Stat Adjustment Considerations
Appendix II: The Best Runnings Backs and Rushing Seasons in NFL History
Part II: Analysis
Orenthal James “O.J.” Simpson was born on July 9, 1947 in San Francisco, CA. He graduated from Galileo High School in 1965 and went on to play for two years at the City College of San Francisco before transferring to the University of Southern California (USC) for his junior and senior seasons.
Simpson led the nation in rushing in each of his two seasons at USC, with 1,543 yards and 13 touchdowns in 11 games in 1967 and 1,880 yards and 23 touchdowns in 11 games in 1968. He earned Consensus All-American and Walter Camp Player of the Year honors both years, finished second in Heisman voting in 1967, and won both the Heisman and the Maxwell Award in 1968. USC won the Rose Bowl and the national championship in 1967; they finished fourth in the AP rankings in 1968.
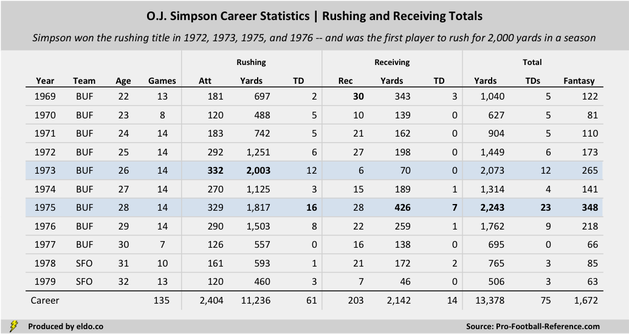
Fresh off a 1-12-1 season, the AFL’s Buffalo Bills selected Simpson first overall in the 1969 AFL-NFL draft. He went on to play for 11 seasons, only thrice finishing with a winning record (1973, 1974, 1975) and only once making the playoffs (1974, then as the lone Wild Card). Here’s how O.J. fared for his career:
Orenthal James “O.J.” Simpson was born on July 9, 1947 in San Francisco, CA. He graduated from Galileo High School in 1965 and went on to play for two years at the City College of San Francisco before transferring to the University of Southern California (USC) for his junior and senior seasons.
Simpson led the nation in rushing in each of his two seasons at USC, with 1,543 yards and 13 touchdowns in 11 games in 1967 and 1,880 yards and 23 touchdowns in 11 games in 1968. He earned Consensus All-American and Walter Camp Player of the Year honors both years, finished second in Heisman voting in 1967, and won both the Heisman and the Maxwell Award in 1968. USC won the Rose Bowl and the national championship in 1967; they finished fourth in the AP rankings in 1968.
Fresh off a 1-12-1 season, the AFL’s Buffalo Bills selected Simpson first overall in the 1969 AFL-NFL draft. He went on to play for 11 seasons, only thrice finishing with a winning record (1973, 1974, 1975) and only once making the playoffs (1974, then as the lone Wild Card). Here’s how O.J. fared for his career:
|
|
When Simpson retired in 1979, he was second in career rushing yards behind Jim Brown; today he is twenty-first. He led the newly merged NFL in rushing four times (1972, 1973, 1975, 1976) and finished third in 1974. In 1973, Simpson became the first player to rush for 2,000 yards – he is the only player to do so in a 14-game season. And if we consider yards from scrimmage and touchdowns, 1975 was even better for O.J. Simpson.
To make Simpson's 14-game numbers easier to understand and compare, let’s look at them on a per-game basis:

In rushing for 2,003 yards over 14 games in 1973, Simpson averaged 143 yards per game, still the best single-season yards per game average in NFL history. In registering 2,243 yards from scrimmage over 14 games in 1975, Simpson averaged 160 yards per game, second only to Priest Holmes in 2002[1].
For recent context, consider how good DeMarco Murray and Le’Veon Bell were in 2014[2]. In 1975, Simpson matched their historic yards from scrimmage totals - 13th and 22nd all-time, respectively - in two fewer games[3]. Per game, Simpson was around 20 yards and almost a full touchdown better than both of them[4]. Football Reference’s Approximate Value statistic places O.J.’s 1975 season in a second-place tie for best all-time by any player at any position.
For recent context, consider how good DeMarco Murray and Le’Veon Bell were in 2014[2]. In 1975, Simpson matched their historic yards from scrimmage totals - 13th and 22nd all-time, respectively - in two fewer games[3]. Per game, Simpson was around 20 yards and almost a full touchdown better than both of them[4]. Football Reference’s Approximate Value statistic places O.J.’s 1975 season in a second-place tie for best all-time by any player at any position.
|
|
My focus the rest of the way will be on rushing rather than yards from scrimmage, so let’s take a deeper look at how Simpson’s performance on the ground lines up historically, and who else is in the mix:

The 2,000-yard club has seven members: Simpson (1973), Eric Dickerson (1984), Adrian Peterson (2012), Jamal Lewis (2003), Barry Sanders (1997), Terrell Davis (1998), and Chris Johnson (2009). But judging single-season rushing performances by way of total yards isn’t so fair when the league(s) played only 12 games from 1947 through 1960 and only 14 games from 1961 through 1977.
Let’s instead consider the “125 yards per game” club, as 125+ yards per game equates to 2,000+ yards over the course of a 16-game season. In doing so, Jim Brown (1958, 1963), Walter Payton (1977), and Earl Campbell (1980) join the party[5], and Simpson (1975) gets a second spot on the list. In total, 10 players have rushed for 125+ yards per game in a season, 12 separate times. O.J. Simpson (1st, 6th) and Jim Brown (2nd, 10th) are the only two players to do so twice.
As you review the list above, you’ll notice impressive yards per attempt averages and heavy attempts per game workloads. Brown achieved 125+ yards per game most efficiently in 1963, averaging 6.4 yards per carry, followed by Sanders (6.1 in 1997), Simpson (6.0 in 1973), and Peterson (6.0 in 2012).
|
|
Let’s separate those variables out for a closer look:
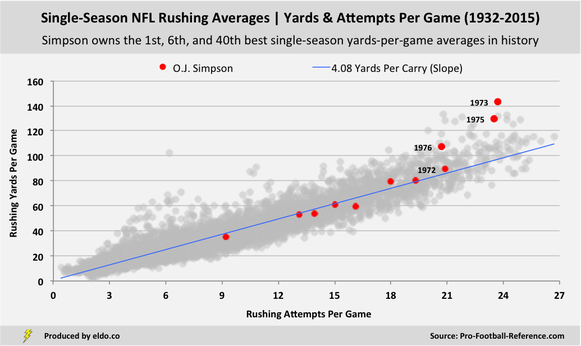
The chart above maps rushing yards per game (y-axis) as a function of rushing attempts per game (x-axis), with league-wide yards per carry represented by the blue trendline[6]. Simpson’s now-familiar 1973 and 1975 campaigns stand out as the first- and sixth-best yards-per-game performances in NFL history. His 1,503 yards over 14 games in 1976 looks superb here too – at 107 yards per game, it’s the 40th best single-season yards-per-game average in history (for rushers with a minimum of 150 attempts)[7].
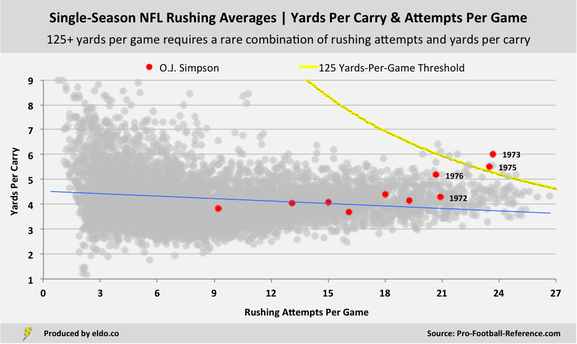
This is no mathematical revelation, but running backs need a lot of yards per carry on a lot of carries to rush for a lot of yards per game. To hit that magical 125 yards-per-game threshold, you need the likes of 5.21 yards per carry on 24 carries per game, or 5.95 yards per rush on 21 rushes per game. To get that many carries and run so efficiently is rare – hence our list of only 10 players and 12 instances.
Over the course of NFL history, a player has averaged 24+ rushes per game 32 times. Only four – the four with the most yards per attempt (Payton ‘77, Lewis ‘03, Campbell ‘80, and Davis ‘98) – ran efficiently enough to average 125+ yards per game. Meanwhile, 23 players have averaged 5.95+ yards per attempt on 9+ carries per game. Only four of them – here the four with the most carries per game (Simpson ‘73, Peterson ‘12, Sanders ‘97, and Brown ‘63) – broke the 125 yard-per-game barrier[8].
Over the course of NFL history, a player has averaged 24+ rushes per game 32 times. Only four – the four with the most yards per attempt (Payton ‘77, Lewis ‘03, Campbell ‘80, and Davis ‘98) – ran efficiently enough to average 125+ yards per game. Meanwhile, 23 players have averaged 5.95+ yards per attempt on 9+ carries per game. Only four of them – here the four with the most carries per game (Simpson ‘73, Peterson ‘12, Sanders ‘97, and Brown ‘63) – broke the 125 yard-per-game barrier[8].
|
|
Let’s take one more look at yards-per-game averages, this time by season and across careers:
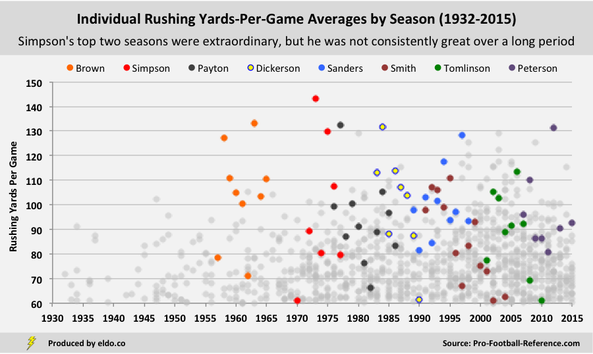
This chart is perhaps the most telling with regard to Simpson’s career. O.J.’s 1973 and 1975 seasons soar high across the top, but if you look horizontally across the middle, you’ll see relatively few red dots. Beyond those two all-time performances, Simpson had but one excellent season (1976) and two very good seasons (1972, 1974). He ran well in 1977 but played only seven games.
Payton, Dickerson, Sanders, and Peterson only managed to match Simpson’s second-best single-season performance once apiece, but they each boast another six to nine very good or excellent seasons. The best single seasons from career rushing leaders such as Emmitt Smith (1st all-time), Curtis Martin (4th), LaDainian Tomlinson (5th), and Jerome Bettis (6th) were only as good as Simpson’s third-best season, but they delivered sustained greatness over long careers.
Thus is the football career of O.J. Simpson. As in life, he was the best of the best when he was at his best, but he wasn’t there for very long.
Appendix I: Historical Trends and Stat Adjustment Considerations - Appendix II: The Best Running Backs and Rushing Seasons in NFL History

|
|
Footnotes
[1] Holmes recorded 2,287 yards from scrimmage in 14 games for the Kansas City Chiefs in 2002, which equates to 163.4 yards per game. He missed the final two games due to injury
[2] In 2014, Murray recorded 2,261 yards from scrimmage (13th most all-time) and 13 TDs, while Bell recorded 2,215 yards from scrimmage (22nd all-time) and 11 TDs, both in 16 games
[3] In 1975, Simpson recorded 2,243 yards from scrimmage and 26 TDs in 14 games. His 14-game total was 18 yards less than Murray (2014) and 28 yards better than Bell (2014), both in 16 games
[4] Simpson '75: 160 yards from scrimmage and 1.6 TDs per game; Murray '14: 141 yards from scrimmage and 0.8 TDs per game; Bell '14: 138 yards from scrimmage and 0.7 TDs per game
[5] Campbell played in a 16-game season in 1980 but was injured in Week 3 after 11 yards on seven carries, and he did not play in Week 4. Staying healthy is part of amassing 2,000 yards, and we don’t want to start over-adjusting for every player-season, but if you remove that brief Week 3 performance, Campbell rushed for 1,927 yards in 14 games, or 137.6 yards per game
[6] The chart includes the top 100 rushers in a 32-team league, or the equivalent thereof. So for a given season, 3.125 times the number of the teams in the league. Seasons are proportionally weighted, so seasons with more teams (i.e., more recent seasons) have greater representation, all of which accrues to the league-wide average of 4.08 yards per carry
[7] Greg Hill (120 yards per game in two games in 1998) and Lionel Vital (115 yards per game in three games in 1987, the only games he ever played) had too few carries to qualify
[8] Gale Sayers (6.2 yards per attempt on 15.3 rushes per game in 1968), Joe Perry (6.1 on 14.4 in 1954), Jamaal Charles (6.4 on 14.4 in 2010), Bo Jackson (6.8 on 11.6 in 1987), Mercury Morris (6.4 on 11.6 in 1973), Beattie Feathers (8.4 on 10.8 in 1934), and others can claim they too might have broken 125 YPG with more carries. But yards per carry (YPC) is a different animal, and we don’t want to “what if” our way into looking only at that metric, or multiplying YPC by some cooked-up carries-per-game number. We’ll address it again in the appendices, but it’s not the purpose of this exercise.
For further reading on yards per carry, Chase Stuart at Football Perspective (and of New York Times and FiveThirtyEight renown) performed an interesting, era-adjusted yards-per-carry analysis
The data source for this article is pro-football-reference.com. Data was compiled and analyzed by ELDORADO. All charts and graphics herein were created by ELDORADO. Historical data includes the American Football League (1960-1969) and All America Football Conference (1946-1949). Regular season statistics only.
ELDORADO | Berkeley, CA | New York, NY
eldo.co | @eldo_co
ELDORADO | Berkeley, CA | New York, NY
eldo.co | @eldo_co
