The 2016 U.S. Men's National Basketball Team Is an Average Version of Itself
And it's below average for a U.S. Olympic team. Should we worry?
JUL 10 2016
Analysis - Appendix I: BPM, Experience, Continuity Detail - Appendix II: 1992, 2004, 2016 Teams
And it's below average for a U.S. Olympic team. Should we worry?
JUL 10 2016
Analysis - Appendix I: BPM, Experience, Continuity Detail - Appendix II: 1992, 2004, 2016 Teams
For those curious, the table below is a repeat of what was presented in the previous section, this time with additional experience and continuity fields. The purple cells highlight highs and the red highlight lows.
Experience includes the average number of NBA seasons completed by players on each team (minimum 20 games in a season), the number of players with previous Olympics, Worlds, or Americas experience, and the total number of major tournaments played in by the members of each team.
Continuity includes the number of players who played together in the preceding tournament, the number who played together two tournaments ago, and -- for Olympic teams -- the number who played together in the previous Olympics (which was itself sometimes two tournaments ago).
The teams with higher cumulative Box Plus/Minus (BPM) tend to be more experienced. They also played together more leading up to their respective tournaments.
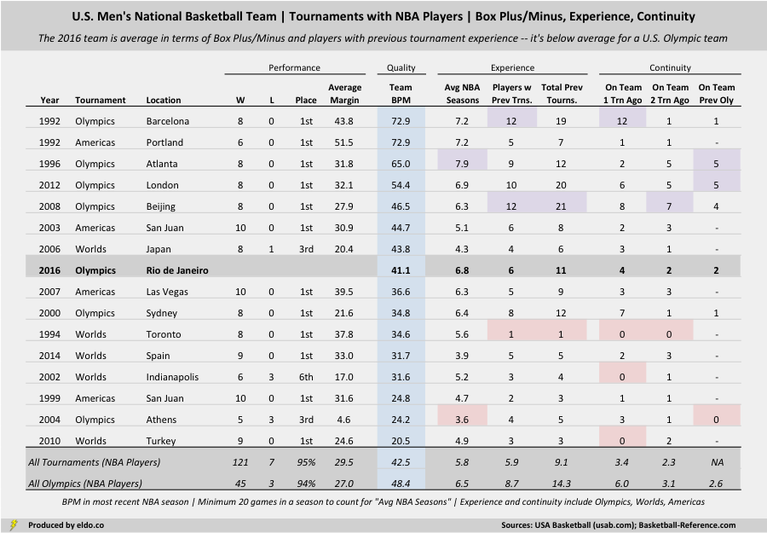
The experience data is probably no surprise. NBA stars in their primes are typically better than NBA stars (or future stars) in the early stages of their careers. If we trust that USA basketball hasn't sent a roster of players that are mostly past their primes, we should expect BPM and NBA experience to correlate (and they do, to the tune of 76%). Better, more seasoned players also have more opportunities to play in major tournaments. So we see a similar correlation between BPM and tournament experience (64%).
The table also reveals that higher quality, more experienced U.S. national teams get to play together more leading up to a given tournament. The tournament calendar dictates some of this, as USA basketball has in certain cycles made a concerted effort to have Olympians play together prior to the Games, opting (sensibly) to send new, inferior, inexperienced teams to non-Olympic tournaments, or to tournaments that immediately follow the Olympics. Most Olympic teams are already really good and really experienced -- the 1992, 1996, 2000, 2008, and 2012 teams got to build chemistry and continuity on top of that, whether at prior tournaments or prior Olympic Games.
The table also reveals that higher quality, more experienced U.S. national teams get to play together more leading up to a given tournament. The tournament calendar dictates some of this, as USA basketball has in certain cycles made a concerted effort to have Olympians play together prior to the Games, opting (sensibly) to send new, inferior, inexperienced teams to non-Olympic tournaments, or to tournaments that immediately follow the Olympics. Most Olympic teams are already really good and really experienced -- the 1992, 1996, 2000, 2008, and 2012 teams got to build chemistry and continuity on top of that, whether at prior tournaments or prior Olympic Games.
|
|
Among Olympic teams, experience and continuity were disregarded in 2004. That team was a perfect storm of low quality, inexperience, and low continuity (for a U.S. Olympic team). The 1996 Olympic team is the only team to have fewer roster members play together in the preceding tournament (two) than the 2004 team (three), but the '96 team was a seasoned group of superstar veterans with five holdovers from the 1992 Dream Team. The 2004 team, meanwhile, had a median age of 23 and zero players from the previous Olympics. Most would also argue that (Tim Duncan aside) its Iverson-Marbury-Marion-Odom-Boozer led attack (yes, really) wasn't quite right for the ever-evolving international game.
In the next appendix, we'll show these same quality-experience-continuity metrics for the 1992 Dream Team, 2004 Bronze Medal Team, and 2016 Rio Olympic Team. You'll see that '92 and '04 were antithetical to one another by most measures. And if you're like me, you might scare yourself into thinking that the 2016 team bears at least some frightening "damn, look who opted out" and "are these really the right guys" traits.

To view the 1992, 2004, and 2016 Olympic rosters in detail, please see Appendix II.
|
|
The data sources for this article are USA Basketball (usab.com) and basketball-reference.com. Data was compiled and analyzed by ELDORADO. All charts and graphics herein were created by ELDORADO.
ELDORADO | Berkeley, CA | New York, NY
eldo.co | @eldo_co
ELDORADO | Berkeley, CA | New York, NY
eldo.co | @eldo_co
