Clinton-Trump Is the Oldest U.S. Presidential Election in History
But relative to life expectancy are they really all that old?
AUG 5 2016
Introduction - Analysis
Appendix I: A Closer Look at Democrats and Republicans, Clinton and Trump
Appendix II: The Oldest and Youngest Candidates in History (Relative to Life Expectancy)
But relative to life expectancy are they really all that old?
AUG 5 2016
Introduction - Analysis
Appendix I: A Closer Look at Democrats and Republicans, Clinton and Trump
Appendix II: The Oldest and Youngest Candidates in History (Relative to Life Expectancy)
Analysis
Let’s start with the more straightforward stuff. This is the election-day age of every presidential candidate in U.S. history who has won - or projects to win - at least 10% of the popular vote[1]:
Let’s start with the more straightforward stuff. This is the election-day age of every presidential candidate in U.S. history who has won - or projects to win - at least 10% of the popular vote[1]:
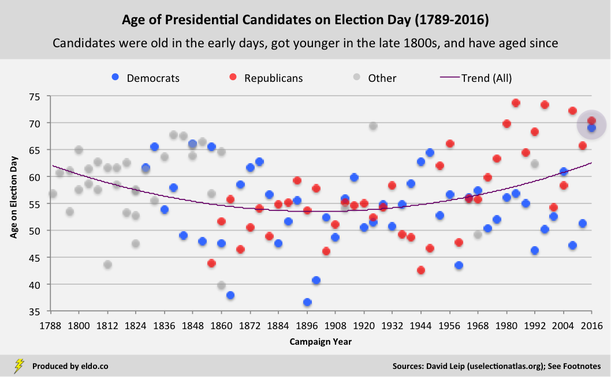
That purple smiley-face trendline indicates that candidates were old in the early days, got younger in the second half of the 1800s, and have aged since. Prior to 2016, modern candidates were, on average, about as old as the founding fathers. A typical mix of young Democrats and old Republicans put us on par with George Washington (56.8 in 1788, 60.7 in 1792)[2], John Adams (61.0 in 1796), and Thomas Jefferson (61.6 in 1804).
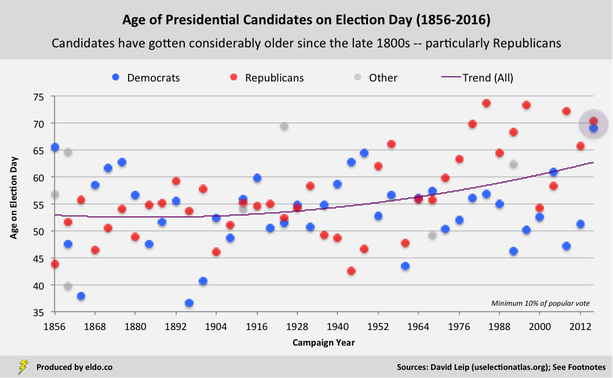
Let’s zoom in on the past 160 years:
Let’s zoom in on the past 160 years:
|
|
After decades of relative youth in the late 1800s – headlined by William Jennings Bryan (36.6 in 1896, 40.6 in 1900), George McClellan (37.9 in 1864), and John Breckenridge (39.8 in 1860) – candidates aged considerably over the course of the 1900s and into the modern day, due in large part to the likes of FDR, Truman, and Eisenhower in the mid-20th century and an array of older Republicans (Ford, Reagan, Bush 41, Dole, McCain, Romney) in the last few decades. During the period, our purple trendline rises by about ten years.
But when we look at age in context of life expectancy, we find that little has changed:
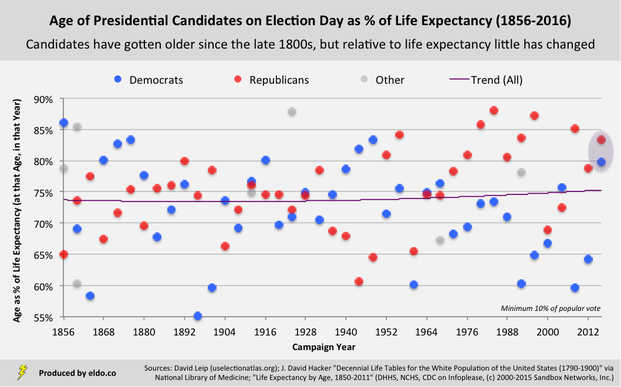
That is to say, when we consider where these candidates are in their lives when they run for president – or what percentage of their projected lives they’ve already lived – our purple trendline is rendered nearly flat. Even though modern-day candidates are considerably older than they were a century ago, they are running for president at pretty much the same point in their lives as their counterparts 50 and 100 and 150 years ago.
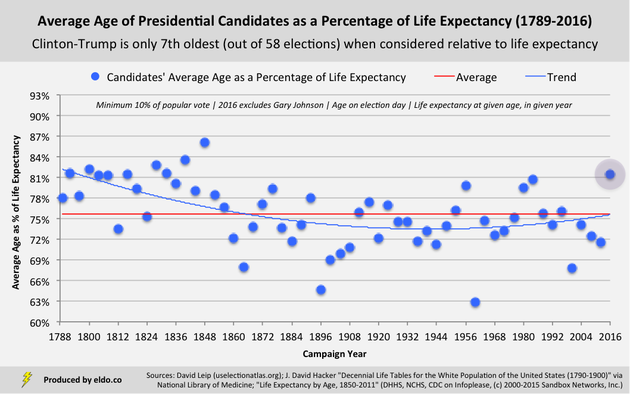
But even after we adjust for life expectancy, Clinton and Trump hover above the trend. What, then, should we make of them? Here’s another look, this time showing the average age of candidates in a given election year:
But even after we adjust for life expectancy, Clinton and Trump hover above the trend. What, then, should we make of them? Here’s another look, this time showing the average age of candidates in a given election year:
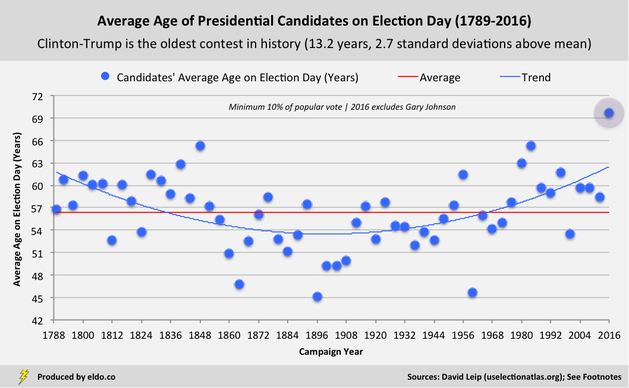
We already know that 2016 is the oldest presidential contest in history. Here we can see just how much of an outlier it is. With an average election-day age of 69.7, Clinton-Trump is 13.2 years and 2.7 standard deviations above the historical average (56.5 years)[3]. They beat their closest competition – 1848 (Zachary Taylor, Lewis Cass, Martin Van Buren) and 1984 (Ronald Reagan, Walter Mondale) – by almost four-and-a-half years.
When we consider age in context of life expectancy, Clinton and Trump lose a little bit of their elderly luster:
When we consider age in context of life expectancy, Clinton and Trump lose a little bit of their elderly luster:
|
|
One hundred years ago, 70-year-olds could expect to live to about 79. If that were still the case, Clinton and Trump would be done with almost 90% of their lives. But today, the 69.0-year-old Clinton can expect to live to 86.6 (she’s 80% of the way there), and the 70.4-year-old Trump can expect to live to 84.5 (he’s 83% of the way there)[4]. The candidates are, on average, 81.5% of the way through their lives. That’s the rough equivalent of being 65 years old in 1988 (similar to George H.W. Bush) or 62 years old in 1952 (similar to Dwight D. Eisenhower[5]).
Relative to life expectancy, 2016 is the seventh oldest presidential election in history (out of 58), and it’s within striking distance (1.2 standard deviations) of historical averages (75.7%). It’s still an old election – the oldest since 1848[6] – it’s just not as old or unique as it might otherwise seem.
From the perspective of where the candidates are in their lives – 80% of the way through for Clinton, 83% for Trump – 2016 is not unlike the nation’s earliest presidential races. Its closest doppelgängers are 1804, when 61.6-year-old Thomas Jefferson (83%) beat 58.7-year-old Charles Pinckney (80%); 1808, when James Madison (57.6, 79%) beat Pinckney (62.7, 84%); and 1816, when James Monroe (58.5, 80%) beat Rufus King (61.6, 83%).
In fact, Hillary Clinton is at a pretty similar point her life (69.0, 80%) as George Washington when he first ran for president in 1788 (56.8, 78%). And Donald Trump is at a similar point in his life (70.4, 83%) as Washington when he won reelection in 1792 (60.7, 82%). So however unprecedented this year's election may be – from Hillary Clinton becoming the first female nominee of a major party to, well, Donald Trump – 2016 is, in at least one strange way, a throwback to the earliest days of the American republic.

In Appendix I, we take a closer look at Democrats and Republicans, Clinton and Trump. In Appendix II, we rank the oldest and youngest presidential candidates in history, relative to life expectancy.
|
|
Footnotes
[1] Gary Johnson currently projects to win 6.6% of the popular vote, which may very well change. For now he is excluded. The National Archives and Records Administration lists no official record of the popular vote until 1824. For purposes of this analysis, we applied common historical convention and incorporated two major candidates from 1796 through 1820 and one major candidate in 1788-89 and 1792 (George Washington) into our analysis..
[2] The first presidential election began on December 15, 1788 and ended on January 10, 1789. It is commonly referred to as the 1789 Presidential Election, which is why we elected to use 1789 in our chart headers. For purposes of this analysis, we used George Washington's age on December 15, 1788. For all other elections, we measured birthdays as of November 1 of the given election year. And for that reason, Washington's two election-day ages are 3.9 years apart, rather than a clean four.
[3] 56.5 is the historical average when you weight elections equally. 56.4 is the historical average across the 124 unique candidates in our sample. Even with the inclusion of Gary Johnson, 2016 would be the oldest presidential in history (67.7 years). It would be 11.2 years and 2.4 standard deviations above the mean.
[4] Ages are presented as of Election Day. Clinton celebrates her 69th birthday on October 26, 2016. Trump turned 70 years old on June 14, 2016. American females have greater life expectancies than American men.
[5] George H.W. Bush was 64.4 on November 1, 1988; Dwight D. Eisenhower was 62.1 on November 1, 1952.
[6] Since 1852, the average "age as a percentage of life expectancy" is 74.0%, with a standard deviation of 7.5%. Clinton-Trump is 1.9 standard deviations above that mean.
Sources
For election information: Leip, David. "David Leip's Atlas of U.S. Presidential Elections". uselectionatlas.org. (c) David Leip, 2008
For life expectancies, 1900 and earlier: Hacker, J. David. "Decennial Life Tables for the White Population of the United States, 1790-1900." Accessed via PubMed Central, a full-text archive of biomedical and life sciences journal literature at the U.S. National Institutes of Health's National Library of Medicine. Published in final edited form as "Hist Methods" 2010 Apr, 43(2): 45-79. J. David Hacker is a Professor at the University of Minnesota.
For life expectancies after 1900: "Life Expectancy by Age, 1850-2011". Infoplease. (c) 2000-2015 Sandbox Networks, Inc., publishing as Infoplease. 30 Jul - 04 Aug 2016 <http://www.infoplease.com/ipa/A0005140.html>. Underlying sources include Death Registration States of 1920; Department of Health and Human Services (DHHS); National Center for Health Statistics (NCHS); Centers for Disease Control and Prevention (CDC); National Vital Statistics Reports.
In the source data, ages are presented in increments of five or ten years. Years are presented decennially or for specific years. For candidate ages and election years that fell between (or after) those presented, I interpolated (or extrapolated) life expectancies based on the data available.
Data was compiled and analyzed by ELDORADO. All charts and graphics herein were created by ELDORADO.
ELDORADO | Berkeley, CA | New York, NY
eldo.co | @eldo_co
ELDORADO | Berkeley, CA | New York, NY
eldo.co | @eldo_co
