Why 2015's NFL Scores Are the Weirdest in History
NOV 23 2015 | UPDATED JAN 8 2016
Part I: Why 2015's NFL Scores Are the Weirdest in History
Part II: Weird Score Redux: What's to Blame, Game by Game?
See Also: How Weird Scores Impact Super Bowl Squares Odds
NOV 23 2015 | UPDATED JAN 8 2016
Part I: Why 2015's NFL Scores Are the Weirdest in History
Part II: Weird Score Redux: What's to Blame, Game by Game?
See Also: How Weird Scores Impact Super Bowl Squares Odds
Introduction: The Familiarity & Significance of NFL Scores
Every day throughout the country, in schoolyards and backyards and city streets, American kids play pickup football. Keeping score has always been easy. There are no field goals (FGs), and until you graduate into more organized leagues, there are probably no extra points (XPs).
Multiples of seven become second nature to a lot of football-minded American kids, as intuitive as increments of five, or even ten. 35 to 21 at recess meant you scored five touchdowns (TDs) and they scored three; 28 to 7 meant you scored four TDs and they managed only one.
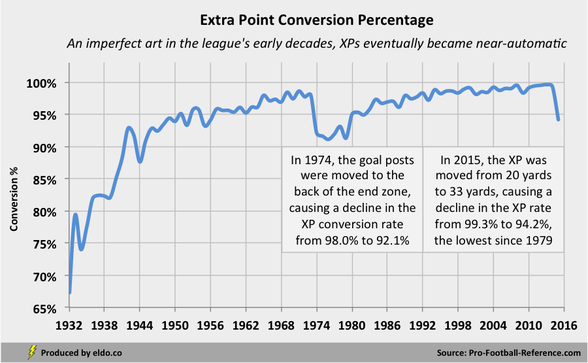
By and large, this approach makes sense – it’s easy, familiar, and realistic. Schoolyard scores resemble real scores, and XPs are (were?) nearly automatic, so a touchdown feels (felt?) like seven points. From 1994 to 2014, the “point after touchdown” was converted at a rate of 98% or greater. The rate had not been below 95% since 1982[1], or below 90% since 1944[2].
Every day throughout the country, in schoolyards and backyards and city streets, American kids play pickup football. Keeping score has always been easy. There are no field goals (FGs), and until you graduate into more organized leagues, there are probably no extra points (XPs).
Multiples of seven become second nature to a lot of football-minded American kids, as intuitive as increments of five, or even ten. 35 to 21 at recess meant you scored five touchdowns (TDs) and they scored three; 28 to 7 meant you scored four TDs and they managed only one.
By and large, this approach makes sense – it’s easy, familiar, and realistic. Schoolyard scores resemble real scores, and XPs are (were?) nearly automatic, so a touchdown feels (felt?) like seven points. From 1994 to 2014, the “point after touchdown” was converted at a rate of 98% or greater. The rate had not been below 95% since 1982[1], or below 90% since 1944[2].
Even with the added complexity of FGs (and the occasional safety or two-point conversion) in real-life games, NFL scores have for decades felt understandable and familiar. When kids and adults turned on games on Sundays[3], they could figure out with relative ease how each team likely did its scoring. Scores like 7, 10, 13, 14, 17, 20, 21, 24, 27, 28, 31, 34, and 35 make sense[4]. And they carry a certain cultural significance. To know them is to know American Football.
But in 2015, NFL scoring feels different. Anecdotally, it seems like we’re seeing more non-traditional (or “non-football”) scores than ever before. In Week 10, there was a 39-32, a 29-13, a 27-26, a 22-20, a 22-17, a 20-19, a 19-13, and an 18-16. Even familiar scores like 16, 20, 23, and 27 can now elicit a head-scratch and some wonder as to whether they were the result not of TDs and FGs, but of a missed XP. It’s confusing, unfamiliar, and arguably un-American[5].
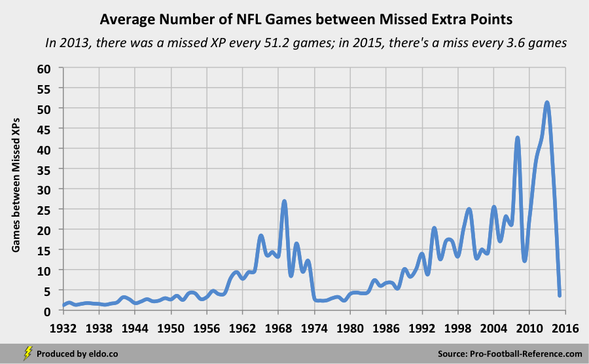
Could those pesky XPs be to blame? Prior to 2015, the NFL moved XPs back from the 2-yard line (a 20-yard kick) to the 15-yard line (a 33-yard kick), and the conversion rate has fallen below 95% for the first time in over 30 years (94.2% through Week 17). Two years ago, a kicker missed an XP once every 51 games; this season, an XP is missed once every three-and-a-half games.
But in 2015, NFL scoring feels different. Anecdotally, it seems like we’re seeing more non-traditional (or “non-football”) scores than ever before. In Week 10, there was a 39-32, a 29-13, a 27-26, a 22-20, a 22-17, a 20-19, a 19-13, and an 18-16. Even familiar scores like 16, 20, 23, and 27 can now elicit a head-scratch and some wonder as to whether they were the result not of TDs and FGs, but of a missed XP. It’s confusing, unfamiliar, and arguably un-American[5].
Could those pesky XPs be to blame? Prior to 2015, the NFL moved XPs back from the 2-yard line (a 20-yard kick) to the 15-yard line (a 33-yard kick), and the conversion rate has fallen below 95% for the first time in over 30 years (94.2% through Week 17). Two years ago, a kicker missed an XP once every 51 games; this season, an XP is missed once every three-and-a-half games.
Along with unprecedented levels of scoring, FG success, and passing TDs, historically low levels of rushing TDs, and the existence of the two-point conversion, the NFL is in uncharted territory. And it may very well be changing the scores we see and how we interpret them.
What exactly are traditional “football scores”? How frequently do they occur? How can they be explained? Is 2015 any different, or are we just paying more attention to weird scores because of the new XP? How does 2015’s scoring fit into the patterns of NFL history? Is this the new normal? And should American kids begin to rethink how they keep score in the schoolyard?
Let’s explore[6].
|
|
I. What are the most common team scores[7] in NFL history?
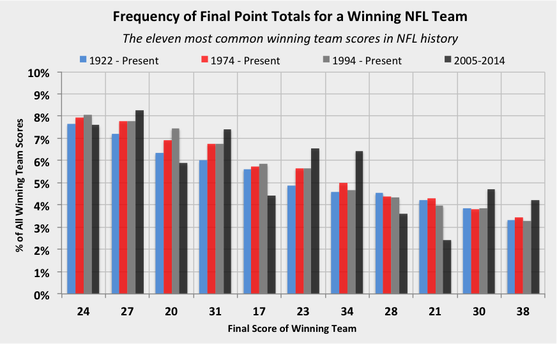
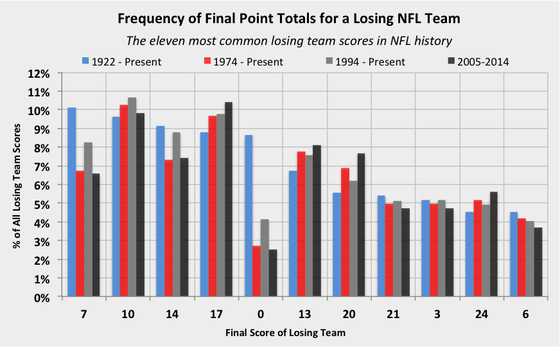
You’re probably used to seeing the scores below. They’re “football scores”. You know what they mean, and sure enough they appear quite often. The most common winning scores are largely consistent[8] and account for around 60% of all winning scores across periods. The most common losing scores are similarly consistent[9] and account for 70% to 80% of all losing scores.
You’re probably used to seeing the scores below. They’re “football scores”. You know what they mean, and sure enough they appear quite often. The most common winning scores are largely consistent[8] and account for around 60% of all winning scores across periods. The most common losing scores are similarly consistent[9] and account for 70% to 80% of all losing scores.
|
|
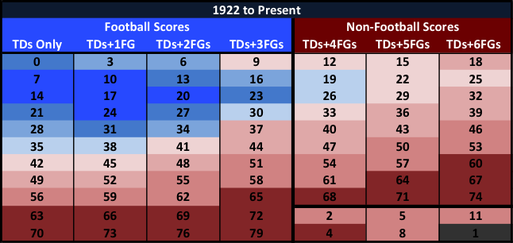
II. What are “football scores” and “non-football scores”?
We can safely define “football scores” as any combination of TDs (with XPs) and zero to three FGs[10]. Every score in the previous section fits this definition. Winners and losers combined, the 18 most common scores in NFL history are “football scores”[11]. They’re frequent and familiar.
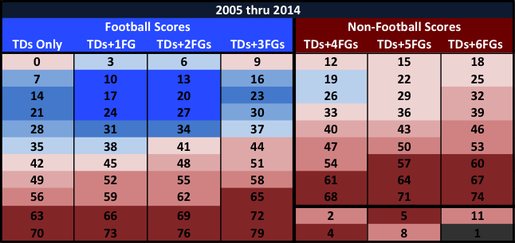
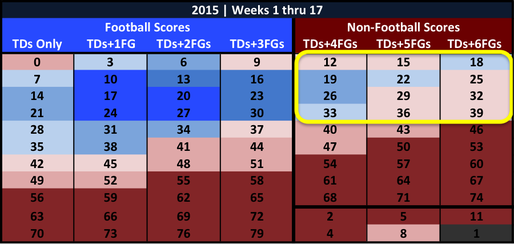
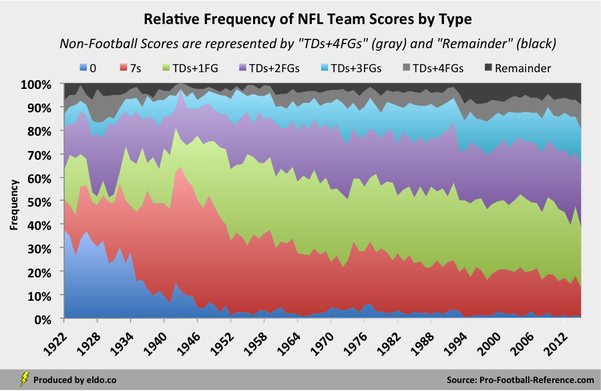
Historically, scores were concentrated around lower totals resulting from TDs only (7, 14, 21, 28) or TDs+1FG (10, 17, 24, 31). In recent decades, scores have migrated to the right[12], with TDs+1FG and TDs+2FGs (13, 20, 27, 34) predominating. So far in 2015, we are seeing unprecedented creep into “non-football scores”, with the blue in the charts crossing farther to the right than ever before.
We can safely define “football scores” as any combination of TDs (with XPs) and zero to three FGs[10]. Every score in the previous section fits this definition. Winners and losers combined, the 18 most common scores in NFL history are “football scores”[11]. They’re frequent and familiar.
Historically, scores were concentrated around lower totals resulting from TDs only (7, 14, 21, 28) or TDs+1FG (10, 17, 24, 31). In recent decades, scores have migrated to the right[12], with TDs+1FG and TDs+2FGs (13, 20, 27, 34) predominating. So far in 2015, we are seeing unprecedented creep into “non-football scores”, with the blue in the charts crossing farther to the right than ever before.

|
|
III. How common are “football scores” and “non-football scores”? Is 2015 unique? (Yes)
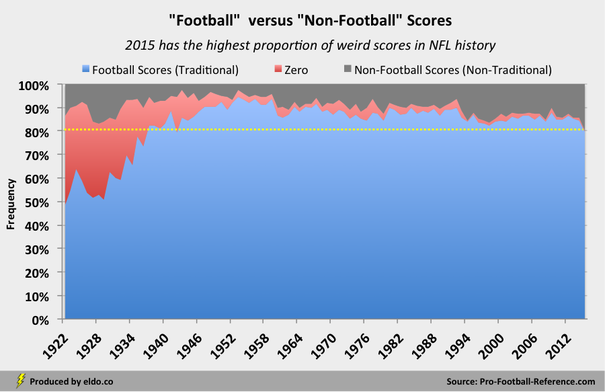
From 1945 through 2014[13], 87.7%[14] of all team scores in the average NFL season were “football scores”, shown in blue in the chart below. This has decreased slightly in recent decades, to 86.3% (1974-2014), 85.0% (1994-2014), and 85.5% (2005-2014), with little deviation[15].
2015 is the first season since since 1942 in which fewer than 80% of all team scores were “football scores”. The regular season finished at 79.8% (blue).
From 1922 through 2014, 9.5%[16] of all team scores in the average NFL season were “non-football scores”, shown in gray in the chart below. This has increased in recent decades, to 11.5% (1974-2014), 13.6% (1994-2014), and 13.2% (2005-2014)[17].
2015 is the first season in NFL history in which greater than 17% of all team scores were “non-football scores”. The regular season finished at 19.7% (gray).
|
|
IV. What explains 2015’s unprecedented level of “non-football scores”?
Let’s take a closer look at trends in NFL team scores. Below, you can see how common zero (blue) was in the early years. Multiples of seven (red, or 7, 14, 21, 28, 35, etc.) owned the 1940s but have decreased considerably over time. TDs+1FG (green, or 3, 10, 17, 24, 31, etc.) accounts for 30% of all team scores since the 1950s and a plurality of outcomes in every season from 1945 through 2012[18].
Let’s take a closer look at trends in NFL team scores. Below, you can see how common zero (blue) was in the early years. Multiples of seven (red, or 7, 14, 21, 28, 35, etc.) owned the 1940s but have decreased considerably over time. TDs+1FG (green, or 3, 10, 17, 24, 31, etc.) accounts for 30% of all team scores since the 1950s and a plurality of outcomes in every season from 1945 through 2012[18].
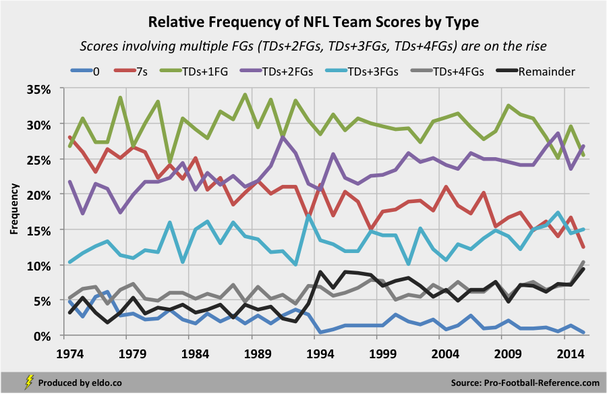
In recent decades, scores involving multiple FGs are on the rise, with TDs+2FGs (6, 13, 20, 27, 34, etc.) passing TDs+1FG for the plurality of outcomes in 2013 and thus far in 2015. TDs+3FGs (9, 16, 23, 30, 37, etc.) and TDs+4FGs (12, 19, 26, 33, 40, etc.) have increased notably as well.
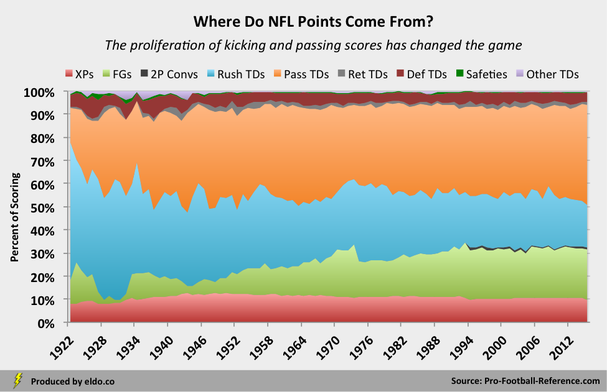
Scores involving multiple FGs are on the rise because (no surprise) FGs are on the rise. Over time, FGs have steadily evolved from a virtual non-factor into a major scoring phenomenon that now accounts for over 20% of NFL points. Kickers have gone from 0.42 made FGs per team per game at 43.8% accuracy (late 1940s), to 0.98 FGs at 61.6% (late 1970s), to 1.63 FGs at 84.5% (2015).
Since 1932, made FGs per team per game has increased by 0.172 every ten years, while “non-football score” frequency has increased by 1.2% every ten years (as a share of all scores). Over that period, there is a 76% correlation between the two, and made FGs per game itself explains 57% of the variance in “non-football score” frequency. In short, more FGs means more “non-football scores.”
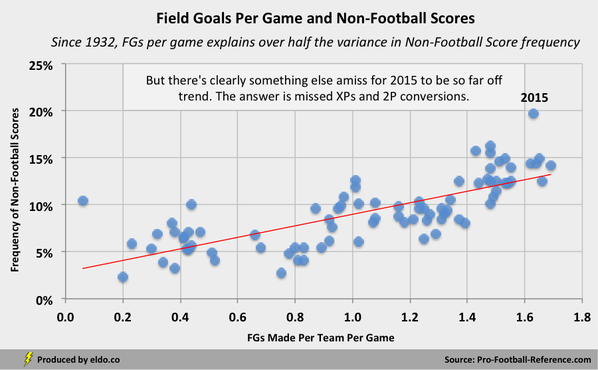
2015 currently boasts the fifth most FGs per game in NFL history[19]. And while the average number of made FGs per team per game (around 2FGs) typically yields a “football score”, more FGs overall means increased instances of 3FGs and 4FGs (and sometimes even 5FGs). That step from 3FGs to 4FGs is a big one, taking us from “football scores” (9, 16, 23, 30, 37) to “non-football scores” (12, 19, 26, 33, 40)[20].
But made FGs per game is not the only variable that matters. If it were, 1.63 FGs per team per game in 2015 would produce around 13% “non-football scores”. Instead, 2015 has given us 19.7% "non-football scores", over four standard deviations above recent averages[21]. Not to mention, with only TDs (plus converted XPs) and FGs, you need to get up to 4FGs or more before team scores start getting weird. That’s where missed XPs and two-point conversions (2Ps) come into play. Together, made FGs per game, missed XPs per game, and 2P attempts per game explain 80% to 85% of the variance in “non-football score” frequency[22].
2015 is a perfect storm across these three variables: the fifth most FGs per game in NFL history, the most missed XPs per game since 1979, and the most 2P attempts per game since 1998. In many ways, the proliferation of FGs (and to some extent the introduction of the 2P conversion in 1994) ushered in an era of 12% to 15% “non-football scores”, and now the XP rule change (with its dramatic increase in missed XPs and modest increase in 2P tries[23]) has pushed us over the edge. With nearly 20% “non-football scores”, 2015 is home to the weirdest scores in NFL history (by far, really)[24].
The answer to the 2015 scoring riddle thus lies primarily on the foot of NFL kickers, though in a manner more complex than a few missed XPs on a Sunday might lead us to think. FG success, rule changes, and passing offense, which enables even more FGs and XPs, have combined to change the cultural institution that is the NFL score. Thankfully, American kids are safe in their schoolyards and backyards and city streets, where there are no FGs to be made or XPs to be missed.

|
|
Footnotes
[1] This season, the XP conversion rate is 94.2% through Week 17
[2] For further reading on NFL kickers and kicking, check out FiveThirtyEight's Kickers Are Forever (Jan 28 2015)
[3] And nowadays Thursdays and Mondays and by season’s end Saturdays
[4] At least at the professional or major collegiate level; high school scores can be all over the map
[5] Insofar as it takes us away from traditional “football scores”; it’s otherwise fun, interesting, and wholly American
[6] In the coming weeks, we will explore margins of victory, total points, passing offense, and other trends in the NFL. We hope to shed further light on what NFL fans (and prognosticators like Bill Simmons and Cousin Sal) have observed and pondered the past few weeks, specifically with regard to weird scores and their possible impact on margins of victory and point spreads in 2015
[7] These are the most common winning and losing team scores (independent of one another), not necessarily the most common final game scores. Note that ties are included in this analysis, with one team categorized as winner and the other as loser
[8] In the period 2005 to 2014, 26 replaces 21 in the top eleven winning team scores, accounting for 3.2% of all winning team scores
[9] In the periods 1994 to present and 2005 to 2014, 16 replaces 0 in the top eleven losing team scores, accounting for 3.7% to 3.8% of all losing team scores
[10] TDs+FGs is designed to categorize scores and is the most common path to most of these scores, but it is (of course) not the only way to achieve them. This is especially so in the TDs+6FGs category, where a score like 18 more likely involves some combination of TDs, FGs, 2Ps, safeties, and missed XPs than it does zero TDs and six FGs. In all instances throughout this article, the TDs+FGs "score types" discussed (e.g., TDs+1FG, TDs+2FGs, TDs+3FGs, etc.) refer to the team scores listed within the category (commonly created via TDs+FGs), regardless of how the score was actually achieved
[11] In the past decade (2005-2014), the 16 most common scores were “football scores”
[12] The blue has also moved slightly down, as scores have increased; note that 1974-2014 and 1994-2014 are very similar to 2005-2014
[13] Seasons are equally weighted for purposes of calculating the average proportion of "football scores" and "non-football scores" per season over a given period. Zero is broken out into its own category and is not included as a “football score”. While historically significant, its prevalence in the early decades of the NFL would overstate “football scores” if included
[14] For the period 1945 through 2014, the standard deviation of the average frequency of "football scores" is 2.9%
[15] Additional “football score” standard deviations are 2.0% (1974-2014), 1.4% (1994-2014), and 1.2% (2005-2014)
[16] For the period 1922 through 2014, the standard deviation of the average frequency of "non-football scores" is 3.5%
[17] Additional “non-football score” standard deviations are 2.6% (1974-2014), 1.5% (1994-2014), and 1.5% (2005-2014)
[18] In 1991, TDs+1FG and TDs+2FG each accounted for 132 of 470 team outcomes, tied for the most that season
[19] 2015 also boasts the 5th most total points per game (45.6, behind 2013, 1965, 1950, 1948) and 3rd highest FG accuracy in NFL history (84.499%, behind 86.5% in 2013 and 84.5% in 2008)
[20] I suspect that that the frequency of 4FGs+ games is itself a powerful explanatory variable; that data will take some work to assemble, but I will share it if and when I can
[21] In 2015, 19.7% "non-football scores" is 4.4 standard deviations above the 2005-2014 average of 13.2% (standard deviation of 1.5%)
[22] Adjusted R-squared is .8153 (1932-present), .8371 (1950-present), and .8288 (1974-present) for all three variables. For 1932-present, the regression equation is Non-Football Scores (as a % of all scores in a given season) = -0.03899 + 0.08833 * Made FGs per team per game + 0.25039 * Missed XPs per team per game + 0.23805 * 2P conversion attempts per team per game
[23] 2Ps can yield weird scores in the case of makes or misses, depending on the score; missed XPs and made 2Ps can sometimes offset back to “football scores”, but their combined presence overall helps explain “non-football scores”
[24] While 2015 remains a relatively small sample size, it seems that some increase in "non-football scores" will be the new normal. Kickers continue to improve, so that means more FGs. Teams are a little more aggressive with the 2P. That said, the trend could be tempered by improved XP conversion (in line with kicker improvement over time), which might also then reduce 2P attempts. The regression equations for the various periods above ultimately predicted 18.2% to 19.7% "non-football scores" in 2015. We finished the season at the very top of this range.
The data source for this article is pro-football-reference.com. Data was compiled and analyzed by ELDORADO. All charts and graphics herein were created by ELDORADO. 2015 results are through Week 17. Historical data includes the AFL (1960-1969) but does not include any other predecessor leagues.
ELDORADO | Berkeley, CA | New York, NY
eldo.co | @eldo_co
ELDORADO | Berkeley, CA | New York, NY
eldo.co | @eldo_co
