The 2016 San Francisco 49ers are on pace to have the worst run defense in NFL history
(They finished with the third worst.)
NOV 13 2016 | UPDATED NOV 15
Final (Full Season) - Original (Thru Week 10)
(They finished with the third worst.)
NOV 13 2016 | UPDATED NOV 15
Final (Full Season) - Original (Thru Week 10)
The first two paragraphs of this story remain were originally written prior to the Sunday of Week 9. All charts, data, historical ranks, and statistical references that follow are updated through Week 10. This story has since been updated through Week 17 and abridged.
Just four seasons removed from a Super Bowl appearance – and a likely Lombardi Trophy if not for some strange play calling inside the ten – the San Francisco 49ers are abysmal. They haven’t won since Week 1, they boast the second-worst record in the NFL (1-7), and they are generally regarded as one of the three or four worst teams in the league. They’re 14-point underdogs this afternoon at Arizona.
With Cowboys-Steelers (and even Dolphins-Chargers) on at the same time on Sunday, there will be little reason to tune into Niners at Cardinals – with one possible exception. The Cardinals are led by running back David Johnson, the NFL’s fourth-leading rusher (705 yards in eight games), and the 49ers yield 193 rushing yards per game – the worst average in the NFL by a mind-boggling 47 yards (Cleveland gives up 146 rushing yards per game). San Francisco has allowed 100-yard rushers in seven straight games, including to Johnson five weeks ago (27 carries, 157 yards, 2 TDs). So there could be some excitement on the ground.
[The Cardinals ended up running the ball only 23 times for 80 yards - an odd choice that seemingly allowed the Niners to stay in the game. In any case, San Francisco's rushing yards against average fell from 193 to 180 as a result. The headline still holds (for now) and the rest of the article (including all charts and references) are updated.]
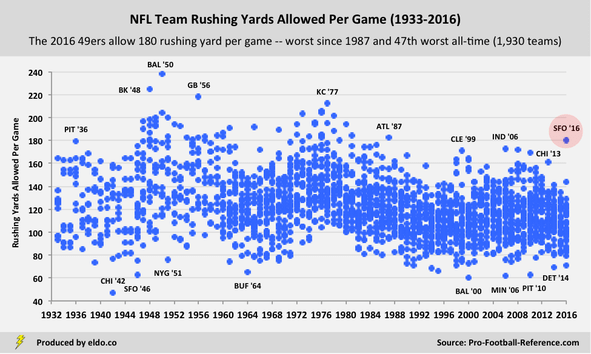
Much has been made of the 49ers defensive futility – but not enough has been made of how historically bad their rushing defense is. 180 rushing yards against per game is the worst mark in the NFL since 1987. It's 47th worst among 1,929 teams since 1933[1].
With Cowboys-Steelers (and even Dolphins-Chargers) on at the same time on Sunday, there will be little reason to tune into Niners at Cardinals – with one possible exception. The Cardinals are led by running back David Johnson, the NFL’s fourth-leading rusher (705 yards in eight games), and the 49ers yield 193 rushing yards per game – the worst average in the NFL by a mind-boggling 47 yards (Cleveland gives up 146 rushing yards per game). San Francisco has allowed 100-yard rushers in seven straight games, including to Johnson five weeks ago (27 carries, 157 yards, 2 TDs). So there could be some excitement on the ground.
[The Cardinals ended up running the ball only 23 times for 80 yards - an odd choice that seemingly allowed the Niners to stay in the game. In any case, San Francisco's rushing yards against average fell from 193 to 180 as a result. The headline still holds (for now) and the rest of the article (including all charts and references) are updated.]
Much has been made of the 49ers defensive futility – but not enough has been made of how historically bad their rushing defense is. 180 rushing yards against per game is the worst mark in the NFL since 1987. It's 47th worst among 1,929 teams since 1933[1].
|
|
What’s more, the 2016 49ers run defense ranks among the worst all-time in an era when teams don’t run the ball all that much. As many fans are aware – and has been dissected on this site – 2016 features the fewest rushing attempts (25.8 per team game through Week 10) and third-fewest rushing yards per game in NFL history (107.0 per team game, third behind 1994 and 1999)[2]. This is what the historical trends look like:
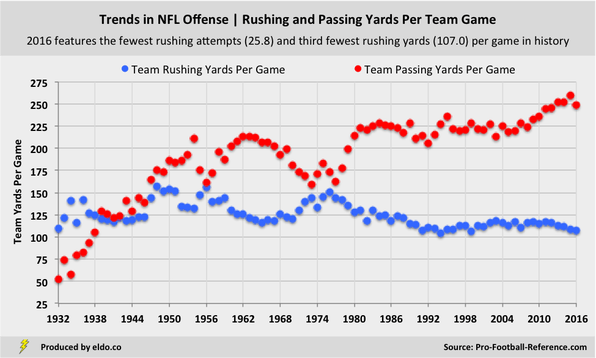
Passing yards are not shown net of yards lost to sacks as they were not tracked for all of NFL history
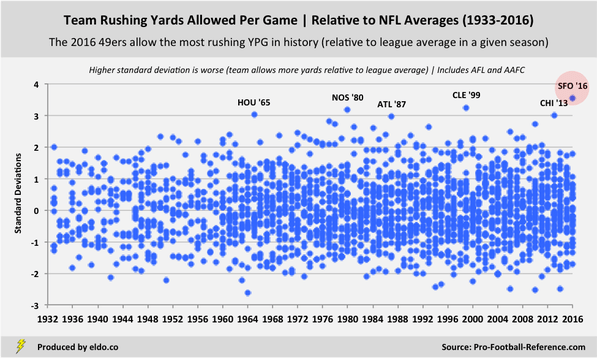
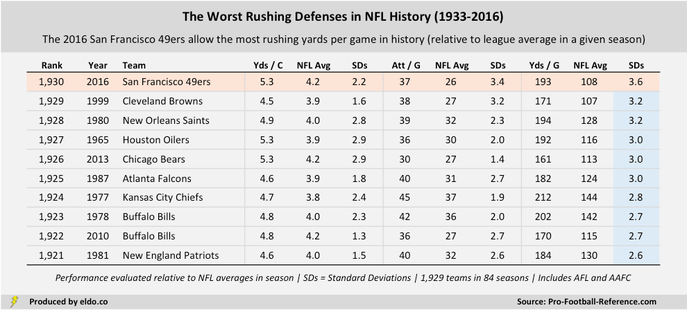
To repeat – the 2016 49ers are giving up the 47th most rushing yards per game out of 1,929 teams since 1933, and they are doing it in the third lightest rushing year ever played. They allow the most rushing yards per game in NFL history relative to the league average in a particular season.
Their 180 yards per game is 3.5 standard deviations above this season’s 107-yard mean. Only three other teams (1999 Browns, 1980 Saints, 1965 Oilers) were 3.0 standard deviations worse than average – and none of them pierced 3.25. This year’s 49ers are the worst all-time by a decent margin.
Their 180 yards per game is 3.5 standard deviations above this season’s 107-yard mean. Only three other teams (1999 Browns, 1980 Saints, 1965 Oilers) were 3.0 standard deviations worse than average – and none of them pierced 3.25. This year’s 49ers are the worst all-time by a decent margin.
|
|
As always, historical feats (of excellence, ineptitude, or happenstance) require a special combination of circumstances. This season, the 49ers bequeath 5.12 yards per carry to opposing rushers – 20th worst all-time in absolute terms and 17th worst relative to 2016's 4.15-yard average (2.2 standard deviations above the mean).
Their 35.2 rush attempts against per game is nothing to write home about in absolute terms – it’s on par with league averages in the run-heavy mid-1950s and mid-1970s and ranks only 385th all-time. But it’s 37% more than the typical team today (3.1 standard deviations above the mean). It's the second biggest outlier in NFL history.
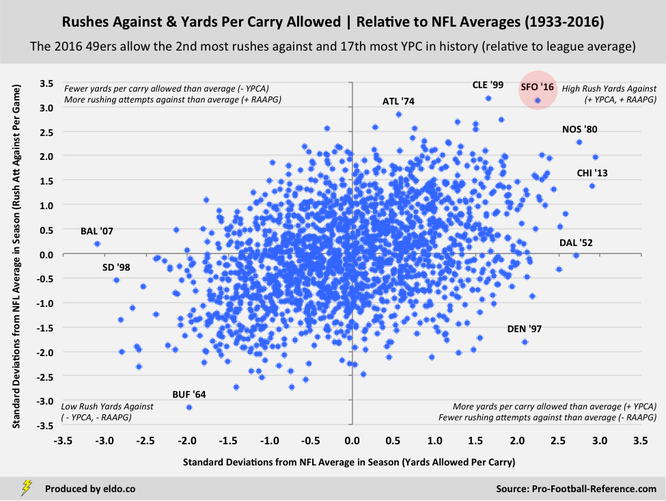
[The 2007 Ravens and 1998 Chargers rank first and second best all-time in yards per carry allowed relative to the league – 3.1 and 2.9 standard deviations below the mean, respectively – but teams nevertheless ran against them at league-average rates. Both went 5-11, possibly explaining some run-out-the-clock rushes against.]
|
|
Below you’ll find the ten worst defenses in history from a “rushing yards allowed per game relative to league average” perspective. Those of you who favor yards per carry as the primary indicator of defensive effectiveness will note that the 1965 Houston Oilers, 2013 Chicago Bears, and 1980 New Orleans Saints are the three worst all-time in that category (relative to the league average in a season)[3].
Every team on the list had a dismal season, with records like 2-14 (1999 Browns), 1-15 (1980 Saints), and 4-10 (1965 Oilers). The lone exception is the 2013 Bears, whose top-quartile offense helped them finish 8-8, only a hair behind the Packers (8-7-1) for the NFC North crown. With one of the NFL’s worst offenses and the league’s lowest time of possession since at least 2003, the 2016 Niners will have no such luck.
On the opposite end of the defensive spectrum lie the best rushing defenses in history. Nearly all enjoyed success – the 2000 Baltimore Ravens famously won the Super Bowl, the 2010 Steelers won the AFC, the 1964 Bills won the AFL, the 1963 Patriots made the AFL Championship, and the 1942 Bears made the NFL Championship. The only team on this list with a losing record is the 2006 Vikings (6-10).
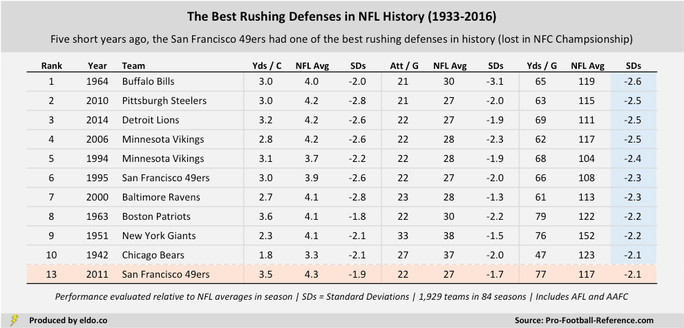
The 2011 San Francisco 49ers rank 13th best in NFL history in rushing yards per game allowed relative to league average – putting them above the 99th percentile among the 1,929 teams since 1933. But in five short years, the franchise went from 77 rushing yards per game allowed to 180 – an astronomical increase of 134%, even as league-wide rushing is down 9% (117.1 yards per team per game to 107.0).
The 49ers rushing defense is now the worst in history. To think how far they’ve fallen. And to think how close they came.
The 49ers rushing defense is now the worst in history. To think how far they’ve fallen. And to think how close they came.

|
|
Footnotes
[1] 1933 is the earliest season for which pro-football-reference publishes opponents' rushing statistics. This analysis includes the American Football League (1960-1969) and All America Football Conference (1946-1949). References to "league history" or "NFL history" include these leagues and conferences.
[2] Data is through Week 10 of the 2016 NFL season and will be updated on an ongoing basis.
[3] We've taken a deep dive into the "yards per carry" versus "yards per game" topic before, at least it relates to individual running backs.
The data source for this article is pro-football-reference.com. Includes AFL (1960-1969) and AAFC (1946-1949). Regular season only. Data was compiled and analyzed by ELDORADO. All charts and graphics herein were created by ELDORADO.
ELDORADO | Berkeley, CA | New York, NY
eldo.co | @eldo_co
ELDORADO | Berkeley, CA | New York, NY
eldo.co | @eldo_co
