Kobe Bryant Is the Second-Worst All-Star Starter in NBA Voting History - Behind Himself
But we don't need stats to know he's a star (and neither does Michael Rapaport)
JAN 3 2016 | UPDATED FEB 11
Voting & PER - Worst Starters - Voting & VORP - Biggest Snubs - Final Thoughts
But we don't need stats to know he's a star (and neither does Michael Rapaport)
JAN 3 2016 | UPDATED FEB 11
Voting & PER - Worst Starters - Voting & VORP - Biggest Snubs - Final Thoughts
III. NBA All-Star Voting & Value Over Replacement Player (VORP)
To capture some of the aforementioned complexity and take a closer look at how fans reward – or fail to reward – statistical performance, let’s zoom in on VORP by position, starting with guards, forwards, backcourt, and frontcourt players:
To capture some of the aforementioned complexity and take a closer look at how fans reward – or fail to reward – statistical performance, let’s zoom in on VORP by position, starting with guards, forwards, backcourt, and frontcourt players:
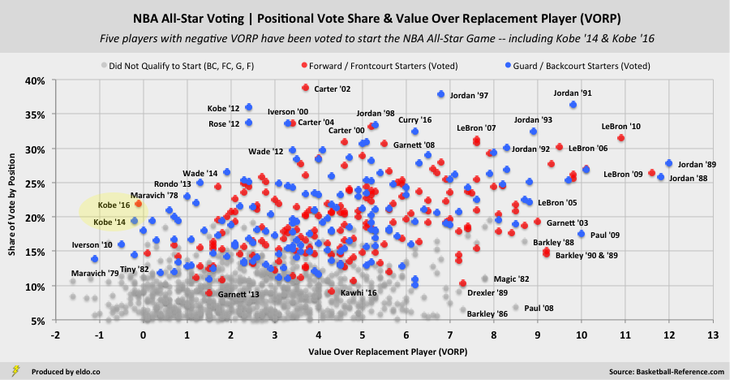
2016 VORP is as of the All-Star break and is thus under-reported for most 2016 players (e.g., Curry finished with 9.8, Kawhi with 6.2). Kobe finished with -0.2.
On the left side of the chart, you can see the five times – Pete Maravich ’79, Tiny Archibald '82, Allen Iverson ’10, and Kobe Bryant ’14 and ’16 – a player was voted to start the NBA All-Star Game in a season for which he posted a negative VORP. All five are stars at the end of their careers. (As noted, players accumulate VORP over the course of the season, and Kobe played only six games in 2014. If you extrapolate his playing time and performance in those six games out to 82 games, he would have finished the season with a VORP of -2.4. He finished 2016 with a VORP of -0.2.)
As you work your way up and to the right, you can see which players – Rondo, Wade, Rose, Bryant, Iverson, and Carter – received high vote shares (25%+) with relatively low VORPs. Michael Jordan and LeBron James dominate the top right of the chart, with all-time great seasons and high vote shares in their respective primes. And toward the bottom right, historically great seasons by Paul, Garnett, Barkley, and Magic were not rewarded with a ton of votes – or in some cases a starting spot.
As you work your way up and to the right, you can see which players – Rondo, Wade, Rose, Bryant, Iverson, and Carter – received high vote shares (25%+) with relatively low VORPs. Michael Jordan and LeBron James dominate the top right of the chart, with all-time great seasons and high vote shares in their respective primes. And toward the bottom right, historically great seasons by Paul, Garnett, Barkley, and Magic were not rewarded with a ton of votes – or in some cases a starting spot.
|
|
This is the same look for centers, which existed as an All-Star position through 2012:
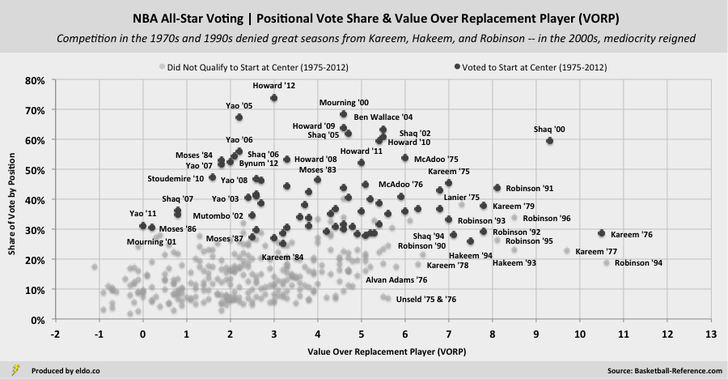
Whereas there is some relationship between VORP and votes for guards and forwards, there is no such relationship for centers. Excellence has been ignored and mediocrity has been rewarded. In terms of VORP, Kareem Adbul-Jabbar and David Robinson are the Jordan and James of their position, albeit with less vote recognition from fans. Meanwhile, Yao Ming rode the international vote and Dwight Howard, Ben Wallace, and late-career Shaq rode a lack of competition at the position to high vote shares in mediocre seasons.
Note that VORP is a little less kind to centers than is PER. While centers’ PERs were crowded toward the right side of the very first chart in part one (with Shaq shining), their VORPs are clustered toward the left side here. Also note that starting centers generally capture a greater share of their position’s vote (~40%) than do guards or forwards (~20%). That's because vote shares are calculated within the top tier of each position; for centers that means votes received as a percentage of the top five, whereas for guards and forwards it's votes received as a percentage of the top ten.
Next: The Biggest Snubs in NBA All-Star Game History
|
|
Vote share methodology and implications
“Positional vote shares” are the votes received by a player in a given season as a percent of the top tier votes at his position in that season. The “top tiers” are top five for centers (1975-2012); top ten for guards (1975-2012), forwards (1975-2012), and backcourt players (2013-2016); and top fifteen for frontcourt players (2013-2016).
This methodology normalizes votes across seasons and allows us to compare “how much of the vote” players received from year to year. It unfortunately leaves us blind to how much of the vote players outside of these top tiers might have received. It also subjects us to inconsistency in the size of the top tier for centers (1975-2012), which is why we broke them out for separate review. Frontcourt players’ vote share (2013-2016) is a little muted as it is calculated among the top fifteen vote getters.
From 1980-1985, the NBA only published the top five vote getters among guards and forwards. To translate this into a top ten equivalent, we used the average vote share obtained by players six through ten at each position in each conference in 1975, 1977, 1978, 1979, 1986, 1987, 1988, and 1989. From 1980-1981, the NBA only published the top three vote getters for centers, requiring translation into a top five equivalent. This and a couple of similar instances were addressed in a similar manner.
We would ideally present vote share as a percentage of all votes recorded in a given season, but it appears that the NBA only publishes results for the aforementioned top 5-10-15 recipients. If anyone is aware of – or has access to – the total number of votes by season, kindly let us know!
Notes
Players displayed as starters are those players who were voted to start the game by the fans, regardless of which player ultimately started (e.g., due to injury replacement).
Statistics are full-season except for the current NBA season, which is through February 10, 2016. Votes are, of course, cast during the first half of the season, without the knowledge or foresight of where a player's full-season stats will end up.
There was no All-Star Game in 1999. Magic Johnson was voted to start the 1992 NBA All-Star Game but did not play a regular season game that season. High PERs by way of only a few games – such as David Robinson’s 1997 – are omitted.
For more on advanced basketball statistics, check out this glossary (with examples, pros and cons) and/or this detailed explanation of BPM and VORP.
The data source for this article is basketball-reference.com. Data was compiled and analyzed by ELDORADO. All charts and graphics herein were created by ELDORADO.
ELDORADO | Berkeley, CA | New York, NY
eldo.co | @eldo_co
ELDORADO | Berkeley, CA | New York, NY
eldo.co | @eldo_co
