The Founding Fathers Warned Us About NBA All-Star Voting
FEB 16 2017 | DATA AS OF FEB 7
FEB 16 2017 | DATA AS OF FEB 7
George Washington and Alexander Hamilton famously spoke of the threats that foreign influence and the tyranny of the masses pose to American democracy. They could just as well have been warning us about NBA All-Star voting.
Since 1975, NBA fans have voted to determine the starting lineups for the Eastern and Western conferences in the league’s annual All-Star Game – two guards, two forwards, and a center through 2012 and two backcourt players and three frontcourt players ever since. Fans owned direct say on starters until this season, when the league unveiled a new fan (50%) – player (25%) – media (25%) weighted score.
That the change kept three fan choices out of this year’s starting lineup (Zaza Pachulia, Dwyane Wade, and Joel Embiid) has generally been considered fine, particularly in the case of Pachulia. But the system remains rife with controversy and criticism – of the fans, of the players, and of All-Star voting writ large – most notably because it left Russell Westbrook, who is averaging a triple-double, out of the starting five.
|
|
I have long been intrigued by the relationship between NBA All-Star voting and player performance. On one hand – I know – it doesn’t really matter. In allowing fans to decide, the NBA prioritized popularity over performance, regardless of whether it was earned by way of a single season, legendary career, dunks and Vines, or home-country support. In that way, players “deserve” precisely the number of votes they receive.
But All-Star voting and player performance still tell us a lot about the NBA – its state and stars, its rivalries and royalty, its overhyped and underappreciated. So I explored the relationship back to 1975, covering 42 All-Star Games, 420 starters, and 1,957 reported vote recipients. (More detail on methodology below.)
Because the total number of votes cast changed significantly over time (even year-to-year or conference-to-conference in the same year), I calculated the percentage of votes a given player received in his conference and among the top ten vote-getters at his position – his “vote share”. [The NBA only reported the top five centers in each conference, so I addressed them separately.]
Here are the results:
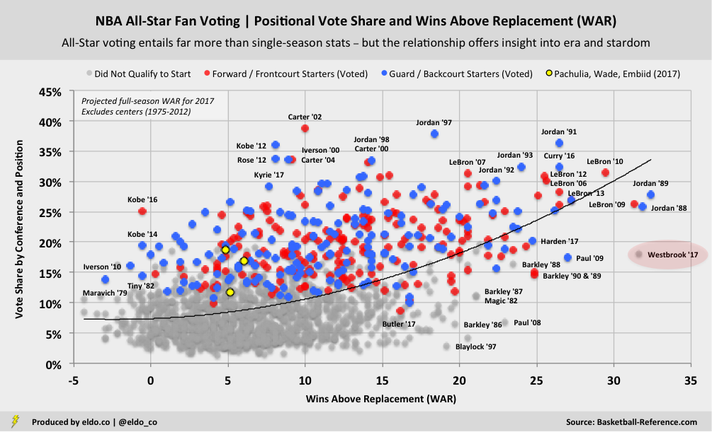
The lockout-shortened 2012 season is shown on an 82-game equivalent basis
There isn’t much of a relationship between vote share and performance for players with ten or fewer Wins Above Replacement (WAR). But as performance escalates, our trend line steepens considerably. At the top-right, no one combined mega-stardom and elite performance like Michael Jordan and LeBron James. Steph Curry snuck in there in 2016, but those stats are tough to maintain playing alongside Kevin Durant.
If you scan down from Jordan and James toward the bottom-right, you’ll find elite seasons from other well-known players that weren’t rewarded with as many votes – or in some cases a starting spot. This season, Westbrook is on pace to have the third-highest WAR of all-time behind Jordan ’89 and ’88 – but the masses preferred Steph Curry and James Harden over him. Fair? I don’t know. But that's the system.
If you scan down from Jordan and James toward the bottom-right, you’ll find elite seasons from other well-known players that weren’t rewarded with as many votes – or in some cases a starting spot. This season, Westbrook is on pace to have the third-highest WAR of all-time behind Jordan ’89 and ’88 – but the masses preferred Steph Curry and James Harden over him. Fair? I don’t know. But that's the system.
|
|
Charles Barkley is a fun and telling example. Barkley’s WAR was second highest in the NBA in 1986 (Larry Bird), third highest in 1987 (Jordan, Bird), and second highest in 1988 (Jordan) – but he couldn’t crack the Bird-Dominique Wilkins stranglehold on the East forward spots until 1989, when Bird was hurt. Fans preferred Bird’s legend and Dominique’s electricity to young Barkley. It worked the way it was designed.
Don’t go feeling bad for Sir Charles. He was voted to start every All-Star Game from 1989 through 1997. And in the last five of those games, Barkley and Shawn Kemp denied Karl Malone – by then the best forward in the West – the same way Bird and Wilkins had denied Barkley back east a few years before.
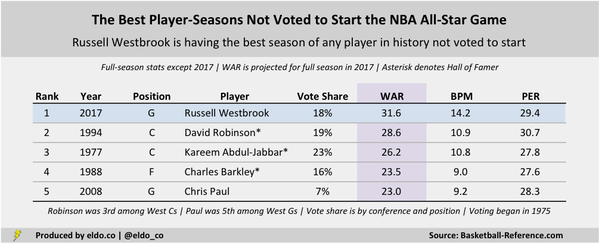
Barkley's 1988 is one of the best seasons in history not voted to start. Westbrook's 2017 is the best:
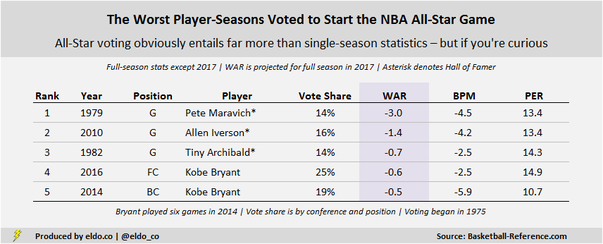
On the other end of the spectrum lie the worst player-seasons in history that were voted to start. By placing the vote in the hands of the fans, the NBA gave people the power to decide that these players deserved to start thanks to their legendary careers. (By slotting Kobe Bryant as a frontcourt player in 2016, the NBA opened the door for Westbrook’s only start.)
|
|
Another way to have fun with this is to look at the biggest single-season “overachievers” in NBA All-Star voting history – players with some of the highest vote shares ever despite less-than-elite WAR. This group is furthest above the trend line in the chart above:
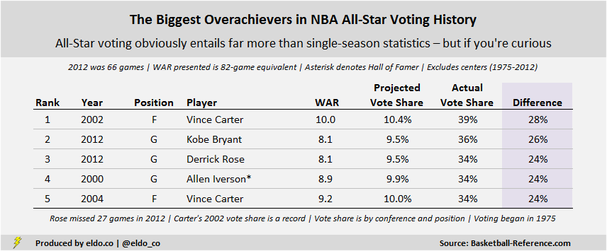
Propelled by the 2000 Dunk Contest, Vince Carter was one of the NBA’s biggest post-Jordan stars – and his competition among East forwards was pretty weak (he started alongside Antoine Walker in 2002 and Jermaine O’Neal in 2004). In 2012, Derrick Rose was only half a season removed from being named MVP.
That same year, Kobe benefitted from a lull among West guards. Chris Paul had arrived, but it was too late for McGrady and Nash and too early for Curry, Harden, and Westbrook, allowing Bryant to record his best vote share in his 14th-best season. Kyrie Irving may be a Finals hero, but his 2017 would be ninth on this list.
That same year, Kobe benefitted from a lull among West guards. Chris Paul had arrived, but it was too late for McGrady and Nash and too early for Curry, Harden, and Westbrook, allowing Bryant to record his best vote share in his 14th-best season. Kyrie Irving may be a Finals hero, but his 2017 would be ninth on this list.
|
|
Here are the top five seasons the fans failed to reward (furthest below the trend line in the chart above):
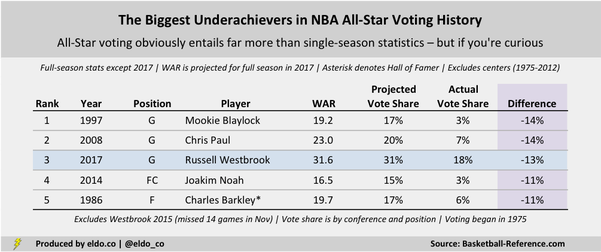
Includes players for whom vote data was reported – see more
Mookie Blaylock had the third-highest WAR in the NBA in 1997 (Grant Hill, Malone), but he finished tenth among East guards and failed to make the All-Star team entirely. Chris Paul’s 2008 is the 33rd-best WAR season in NBA history (second to LeBron that year), but he was a small-market third-year player in the early throes of his first great season when voting took place. Like Barkley in 1986, it was just a little too soon.
The list above only includes players who finished in the top reported tier in their conference and position. The real travesty may lie with great player-seasons that weren’t even voted into the top tiers. The broader list includes a lot of Andrei Kirilenko, Andre Iguodala, Hersey Hawkins, Elton Brand, and Lamar Odom. Today, Gordon Hayward and Rudy Gobert appear to be the heirs to the throne of fan underappreciation.
The list above only includes players who finished in the top reported tier in their conference and position. The real travesty may lie with great player-seasons that weren’t even voted into the top tiers. The broader list includes a lot of Andrei Kirilenko, Andre Iguodala, Hersey Hawkins, Elton Brand, and Lamar Odom. Today, Gordon Hayward and Rudy Gobert appear to be the heirs to the throne of fan underappreciation.

|
|
Methodology and Implications
Players displayed as starters are those voted to start by the fans (or fans-players-media in 2017), regardless of who actually started the game (e.g., due to injury). There was no NBA All-Star Game in 1999. Seasons are identified by the year in which they conclude (and when the All-Star Game is played). This season is “2017”.
The statistics reflected above are full-season except for 2017, for which stats are through February 7, 2017. Votes are, of course, cast during the first half of the season, without the knowledge or foresight of where a player's full-season stats will end up. I noted key injuries where relevant (e.g., Westbrook in 2014-2015).
For 2017 WAR, I extrapolated current performance and minutes played through the rest of the season in order to produce a full-season 2017 WAR projection. For 2012 WAR, I calculated 82-game equivalent WAR because the season was only 66 games long due to a lockout, again keeping existing performance and minutes played constant. WAR would otherwise be understated in 2012 relative to all other seasons.
As explained above, the number of NBA All-Star votes cast by fans cast varies wildly from year to year (and even conference to conference). In order to normalize and compare across seasons and eras, I calculated the percentage of the vote a player received in his conference and at his position (“vote share”).
I would ideally present vote share as a percentage of all votes recorded in a given season, but the NBA does not publish data on total votes (though they did release pretty extensive vote data this year). Historically, the league published the top five vote getters for centers (1975-2012); top 10 for guards (1975-2012), forwards (1975-2012), and backcourt players (2013-2017); and top 15 for frontcourt players (2013-2017).
These lists are obviously different sizes, which would over-represent vote share for centers (calculated out of five) and under-represent it for frontcourt players (calculated out of 15). As a result, I decided to break centers out for separate review (last year) and measure frontcourt players’ vote share as a percentage of the top 10, aligning them with guards, forwards, and backcourt players (everyone else except centers).
From 1980-1985, the NBA only published the top five vote getters among guards and forwards. To translate this into a top-ten equivalent, I used the average vote share obtained by players six through ten at each position in each conference in 1975, 1977, 1978, 1979, 1986, 1987, 1988, and 1989. From 1980-1981, the NBA only published the top three vote getters for centers, requiring translation into a top-five equivalent.
I elected to measure vote share within conference in order to highlight the competition among stars for only two or three starting All-Star spots. That is, after all, how the votes are cast and starting lineups are chosen. But because the total number of votes cast can vary from conference to conference within the same season, calculating vote share within conference can affect inter-conference comparisons.
Calculating vote share by position within conferences and calculating it by position across conferences are both viable, and each has pros and cons. If I run this back next year, maybe I’ll use the latter methodology.
The data source for this article is basketball-reference.com. Data was compiled and analyzed by ELDORADO. All charts and graphics herein were created by ELDORADO.
ELDORADO | Berkeley, CA | New York, NY
eldo.co | @eldo_co
ELDORADO | Berkeley, CA | New York, NY
eldo.co | @eldo_co
