Margins of Victory through NFL History
Despite its weird scores, 2015 had the most "normal" margins of victory in NFL history
FEB 23 2016
Despite its weird scores, 2015 had the most "normal" margins of victory in NFL history
FEB 23 2016
In recent months, we devoted a great deal of attention to exploring and explaining 2015’s weird NFL game scores, which ultimately proved to be the weirdest in history (by far)[1].
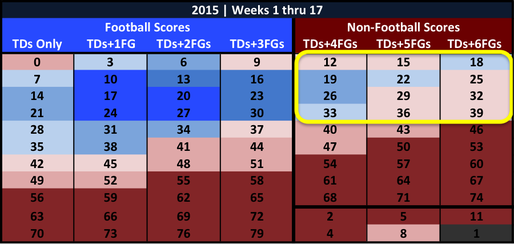
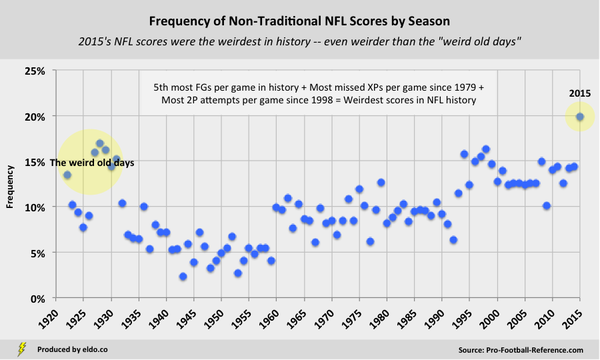
In doing so, we learned that 19.9% of NFL team scores in 2015 were non-traditional (15, 18, 19, 22, 25, 26, 29, 32, 33, 36, 39, etc.), compared to averages of 13.6% in the previous 20 years, 11.5% in the previous 40 years, and 9.5% all-time[2]. The previous high was 16.98%, way back in 1928. Since then, non-traditional score frequency had exceeded 15% only five other times[3].
In doing so, we learned that 19.9% of NFL team scores in 2015 were non-traditional (15, 18, 19, 22, 25, 26, 29, 32, 33, 36, 39, etc.), compared to averages of 13.6% in the previous 20 years, 11.5% in the previous 40 years, and 9.5% all-time[2]. The previous high was 16.98%, way back in 1928. Since then, non-traditional score frequency had exceeded 15% only five other times[3].
Beyond the cultural significance of seeing “traditional football scores” give way to 18-16, 35-18, 26-20, 20-18, and 49-15 (all in the 2015 playoffs alone) – and their annual impact on Super Bowl Squares probabilities – we began to wonder how weird scores might also affect margins of victory, which carry more practical implications than mere (and admittedly strange) intrigue.
Anecdotally, it sure seemed like 2015's weird scores were messing with traditional NFL margins of victory. Consider Steelers-Bengals in the Wild Card (18-16), Broncos-Patriots in the AFC Championship (20-18), or if Denver missed their two-point conversion late in the Super Bowl (and won 22-10 instead of 24-10)[4]. Think back to how it felt when your kicker missed an extra point (XP), you saw a line you thought was funky, or you lost a bet because you had a favorite minus 2.5 that missed an XP and won by two instead of three.
Were 2015's margins of victory actually different, or were we just paying more attention to the weird ones because of the new XP and strange scores? Let’s explore.
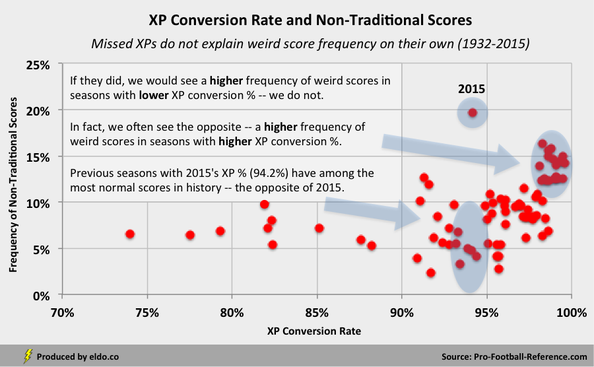
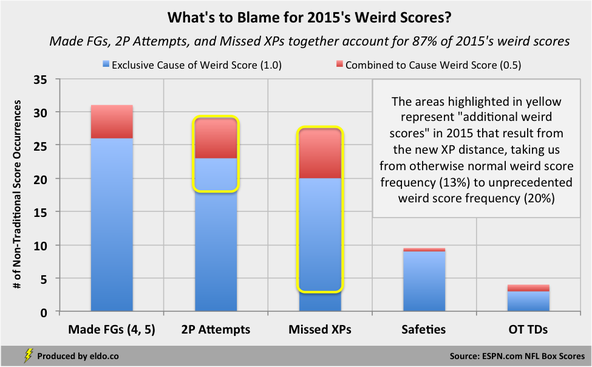
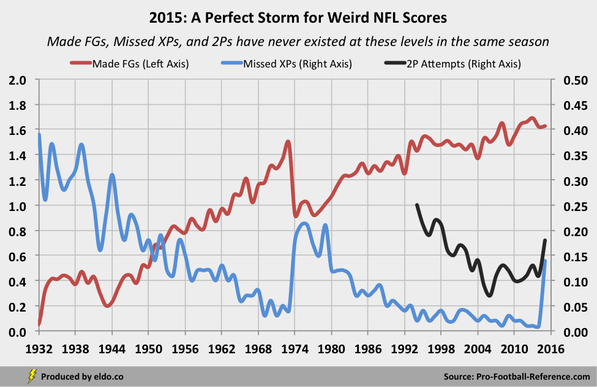
(Note: While it’s easy to point a finger at the new XP distance as the cause of weird scores, recall that the multitude of NFL seasons with XP conversion rates similar to or worse than 2015's rate (94.2%) produced very normal scores, including the most normal scores in NFL history. The new XP pushed us over the edge in 2015, but missed XPs do not explain weird score frequency on their own. Made field goals, missed XPs, and two-point conversions (which are influenced by XPs) together explain weird scores. The three variables never existed at such high levels at the same time until 2015, and that perfect storm combined to produce the weirdest scores in NFL history.)
Anecdotally, it sure seemed like 2015's weird scores were messing with traditional NFL margins of victory. Consider Steelers-Bengals in the Wild Card (18-16), Broncos-Patriots in the AFC Championship (20-18), or if Denver missed their two-point conversion late in the Super Bowl (and won 22-10 instead of 24-10)[4]. Think back to how it felt when your kicker missed an extra point (XP), you saw a line you thought was funky, or you lost a bet because you had a favorite minus 2.5 that missed an XP and won by two instead of three.
Were 2015's margins of victory actually different, or were we just paying more attention to the weird ones because of the new XP and strange scores? Let’s explore.
(Note: While it’s easy to point a finger at the new XP distance as the cause of weird scores, recall that the multitude of NFL seasons with XP conversion rates similar to or worse than 2015's rate (94.2%) produced very normal scores, including the most normal scores in NFL history. The new XP pushed us over the edge in 2015, but missed XPs do not explain weird score frequency on their own. Made field goals, missed XPs, and two-point conversions (which are influenced by XPs) together explain weird scores. The three variables never existed at such high levels at the same time until 2015, and that perfect storm combined to produce the weirdest scores in NFL history.)
|
|
I. Key Numbers
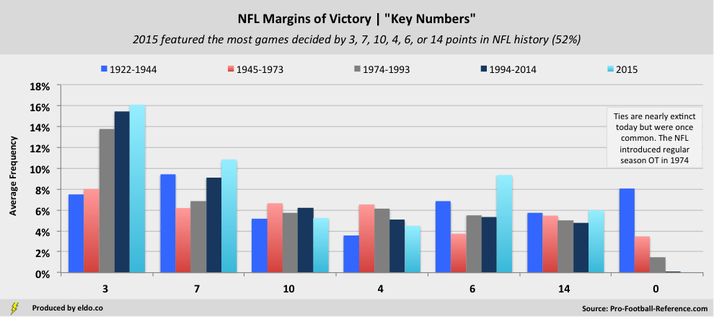
We know what traditional scores look like, but what are “normal” margins of victory in the NFL? If you’re a football fan, the margins of victory presented below – 3, 7, 10, 4, 6, and 14 – are likely second nature to you. They are the most common margins of victory in NFL history, each accounting for at least 5% of results and together accounting for 42.5% of results since 1922.
We know what traditional scores look like, but what are “normal” margins of victory in the NFL? If you’re a football fan, the margins of victory presented below – 3, 7, 10, 4, 6, and 14 – are likely second nature to you. They are the most common margins of victory in NFL history, each accounting for at least 5% of results and together accounting for 42.5% of results since 1922.
For a detailed look at winning and losing team score distributions and the sources of NFL points over time, check out The Trends & Scores Behind the Story
From 1974-2014, an average of 45.0% of NFL games finished with a margin of victory of 3, 7, 10, 4, 6, or 14 (standard deviation of 3.55%). In 2015, 52.1% of games were decided by these “key numbers” – the most in NFL history. And so the season with the weirdest scores in NFL history gave us the most normal margins of victory in NFL history.
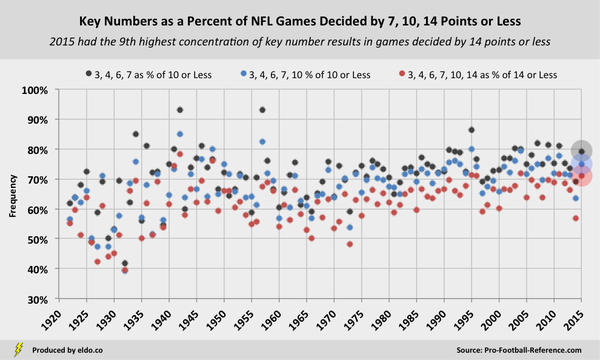
2015 had the most games decided by 3, 4, 6, or 7 points, 2nd most decided by 3, 4, 6, 7, or 10 points, and 4th most decided by 3 or 7 points. See postscript on methodology for more detail.
|
|
II. Close Games
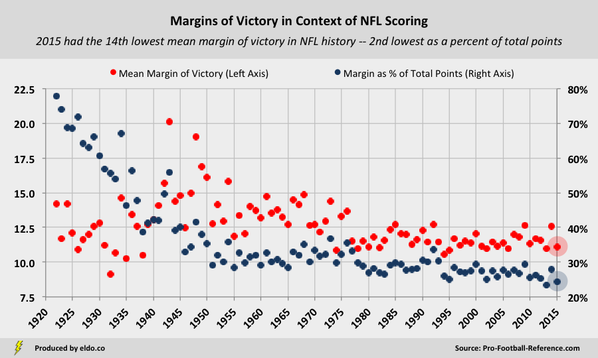
At the NFL’s League Meeting in Dallas on December 2, 2015, Commissioner Roger Goodell stated, “I don’t think we’ve ever had a more competitive season. Our margin of victory is near an all-time low, if not an all-time low. The number of games within seven points is in the same category.”
The 2015 NFL season ultimately had the 14th lowest mean margin of victory (11.1 points) and lowest median margin of victory (7.0 points) in history, the latter tied with 1994, 1991, 1938, 1928, and 1923. Its mean margin of victory is second lowest ever as a percent of total points per game (24.4% of 45.5 points, behind 2013) and its median margin of victory is lowest ever as a percent of total points (15.4%).
2015 had the fourth most games[5] decided by seven points or fewer (51.7%)[6], the seventh most decided by ten points or fewer (61.4%)[7], and the seventh most decided by 14 points or fewer (73.4%)[8]:
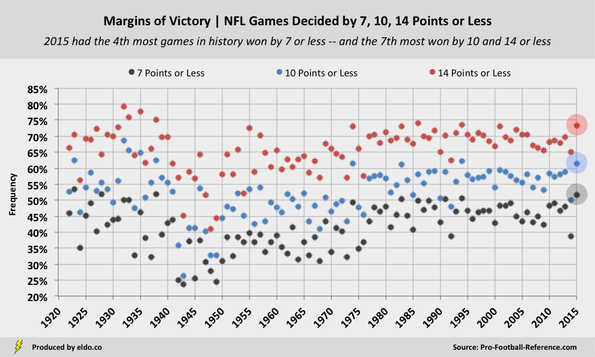
Our key numbers – 3, 7, 10, 4, 6, 14 – all live in these low ranges, so a high concentration of games decided by seven, ten, and fourteen points or fewer[9] increases the chances that “normal” margins of victory will occur. But close games are only half the story[10].
|
|
III. The Most Normal Margins of Victory in NFL History
To produce the most normal margins of victory in NFL history, 2015 needed both a high percentage of close games (7th most all-time, as seen above) and a high percentage of key number results within those close games (9th most all-time, as you'll see below).
To produce the most normal margins of victory in NFL history, 2015 needed both a high percentage of close games (7th most all-time, as seen above) and a high percentage of key number results within those close games (9th most all-time, as you'll see below).
There are seasons with more close games and seasons with a higher concentration of key number results within close games, but 2015 is unique in that it is near all-time highs for both[11]:
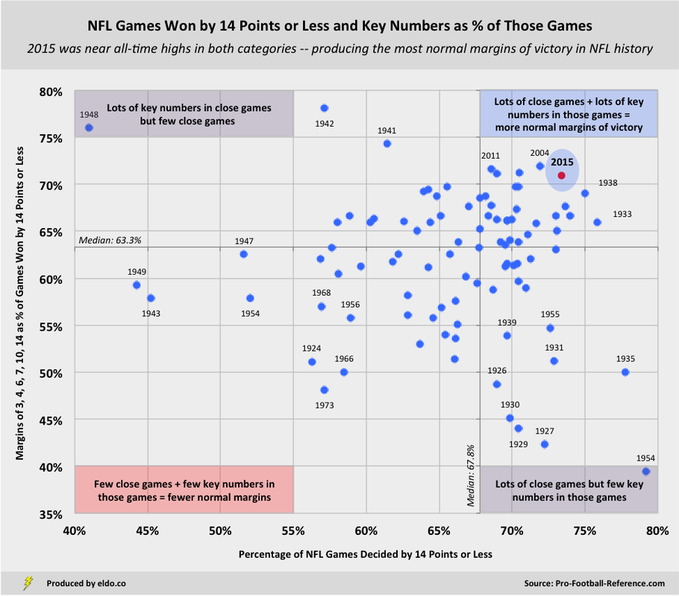
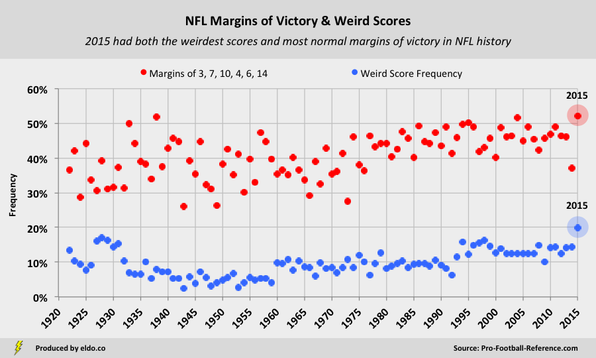
If weird scores were turning would-be margins of 3, 4, 6, 7, 10, and 14 into 2, 5, 8, 9, 11, 12, and 13 -- as so many suspected -- then 2015 would fall straight down into the bottom-right quadrant of the chart above, and its margins of victory would be pretty ordinary. But that didn't happen.
So despite the recent anecdotes, missed XPs and two-point conversions that so memorably won or lost you bets, and season-long speculation that the new XP and weird scores were bastardizing NFL margins of victory, 2015 ultimately proved to have both the weirdest scores and the most normal margins of victory in NFL history.
So despite the recent anecdotes, missed XPs and two-point conversions that so memorably won or lost you bets, and season-long speculation that the new XP and weird scores were bastardizing NFL margins of victory, 2015 ultimately proved to have both the weirdest scores and the most normal margins of victory in NFL history.

|
|
Postscript on Weird Scores, Point Spreads, Methodology, Overtime, and Specific Scores
Weird Scores: 2015 was home to both the weirdest scores and most normal margins in NFL history, but its weird scores did not “produce” those normal margins of victory. In 2015, 93 games featured at least one weird team score; 13 of those games had two weird scores. Of the 80 games in which only one team finished with a weird score, 57 were decided by 14 points or less (71.3%, in line with the season’s overall rate). Of those 57 games, only 22 finished with a normal margin of victory (27.5%, far below the season’s overall rate). Of the 174 games in which neither team had a weird score, 127 were decided by 14 points or less (73.0%). And of those 127 games, 107 finished with a normal margin of victory (84.3%). Weird scores are indeed a red herring.
While 2015's weird scores created very few normal margins, it is possible that 2015's weird scores produced more normal margins than did weird scores in previous seasons. Exploring that would require a game by game analysis of each of those weird score games across seasons. It is also possible that 2015's games without weird scores produced more normal margins of victory than similar games in previous seasons, due perhaps to variables such as the two-point conversion - as in the case of a team going for two to reduce a late-game deficit to three points (albeit five if they miss). However a preliminary look indicates that two-point conversions offer little in the way of explanatory power.
Point Spreads: We also took a preliminary look at ten years' worth of point spreads (2006-2015). We observed that the median point spread was lowest in 2015 (3.5 points), in line with the fact that 2015's median margin of victory was the lowest in the set (7.0 points). The median point spread was highest in 2009 (6.0 points), in line with the fact that that 2009's median margin of victory was tied for highest in the set (10.0 points, along with 2007 and 2014). There is a 75% correlation between median margins of victory and median point spreads, with median margins explaining 50% of the variance in median spreads. Other noteworthy observations include a high frequency of 6s in 2015 (7.5%, 2.5 standard deviations above its 2006-2014 average of 4.1%) and 1s (7.1%, 2.3 standard deviations above its 2006-2014 average of 3.8%). Point spreads - and over/unders - are ripe for further exploration. Our point spread source was http://www.footballlocks.com/.
Methodology: We used key numbers of 3, 7, 10, 6, 4, and 14 to define "normal margins of victory", as each accounts for at least 5% of margins of victory in the history of the NFL (1922-2015, cumulatively) and in the average NFL season (1922-2015, seasons equally weighted). With the exception of the league’s early years (with its many ties), they are the six most common margins of victory across periods. If we instead defined “normal margins of victory” as 3, 4, 6, and 7 (removing 10 and 14), 2015 would still be the most normal season for margins of victory in NFL history, with 40.8% of games decided by 3, 4, 6, or 7 points. Had we defined “normal margins of victory” as 3, 4, 6, 7, and 10 (removing 14), 2015 would be the second most normal season for margins of victory in NFL history, with 46.1% of games decided by 3, 4, 6, 7, or 10 points (behind 1995, with 46.2%). And if we looked only at 3 and 7, 2015 would tie 2002 for fourth all-time, with 27% of games decided by exactly 3 or 7 points, behind 2004 (28.5%), 2003 (28.5%), and 2001 (27.4%).
Overtime (OT): Regular season OT was introduced in 1974, and in the NFL’s early decades, ties were commonplace, averaging 11.4% of results from 1922-1932 and 8.1% of results from 1922-1944. If you assume that all of those ties would have ended in 3 or 6 points (key numbers) had OT existed, then 2015’s margins of victory would be the sixth most normal in history, behind 1933, 1938, 1923, 1925, and 1932. While that might feel like a fair and valuable adjustment, most ties in that era were 0-0, 3-3, 6-6, and 7-7, so it is likely that most of those games would have remained ties even with OT.
Specific Winning and Losing Scores: For a detailed analysis of specific winning and losing team scores, their seasonal distributions, how they've changed over time, the factors driving those changes, and the ever-changing sources of NFL points, please see Super Bowl Box Redux: The Trends and Scores Behind the Story. The analysis was originally conducted in context of final digits and Super Bowl Squares, but its content is highly relevant.
Footnotes
[1] Over four standard deviations above the mean for the previous twenty seasons (1994-2014, mean of 13.6%, standard deviation of 1.5%)
[2] Standard deviations are 1.5% (1994-2014), 2.6% (1974-2014), and 3.5% (1922-2014)
[3] 1929, 1931, 1994, 1997, and 1998
[4] We freely admit that we were rooting for the Broncos to miss that two-point conversion so as to have a Super Bowl (potentially) end with a weird score (22-10)
[5] "Most games" is used in the text above as shorthand for "highest percentage of games"
[6] The seasons with the highest percentage of games decided by seven points or fewer are 1923 (53.4%), 1938 (51.8%), and 1928 (51.8%). 2015 is 4th all-time with 51.7%
[7] The seasons with the highest percentage of games decided by ten points or fewer are 1932 (68.8%), 1933 (65.5%), 1935 (64.8%), 1938 (62.5%), 1923 (62.5%), 1994 (62.1%). 2015 is 7th all-time with 61.4%
[8] The seasons with the highest percentage of games decided by fourteen points or fewer are 1932 (79.2%), 1935 (77.8%), 1933 (75.9%), 1938 (75.0%), 1986 (74.0%), 1994 (73.6%). 2015 is 7th all-time with 73.4%
[9] You'll notice that our charts say "7, 10, and 14 points or less" while our text says "7, 10, and 14 points or fewer". The traditionalists among you will likely prefer the latter, but when talking sports, we're in the camp that believes it simply feels more natural to say "X points or less", so we split the difference. Check out this interesting post on the matter as it relates to points in sports. And imagine for a moment that Jack McCallum's seminal book on the D'Antoni-Nash-Stoudemire-Marion Phoenix Suns were titled "Seven Seconds or Fewer" instead of "Seven Seconds or Less"
[10] By "close games", we refer to games decided by seven, ten, and fourteen points or fewer. With an average margin of victory of 11.1 points in 2015, these categories (especially 14 points or fewer) include some games that are not really all that close. And back when teams didn't score many points, games decided by upward of 14 points were even less close. In any case, consider it shorthand
[11] We defined normal margins of victory as key numbers in close games (3, 7, 10, 4, 6, 14), so high concentrations of close games and high concentrations of key numbers within those close games will inevitably produce more normal margins of victory. Multiply the proportion of games decided by 14 points or fewer by the proportion of those games decided by 3, 7, 10, 4, 6, and 14 points and you arrive at the frequency of normal margins of victory in a given season.
The data source for this article is pro-football-reference.com. Data was compiled and analyzed by ELDORADO. All charts and graphics herein were created by ELDORADO. Regular season and playoff results are included. Historical data includes the AFL (1960-1969) but does not include any other predecessor leagues.
ELDORADO | Berkeley, CA | New York, NY
eldo.co | @eldo_co
ELDORADO | Berkeley, CA | New York, NY
eldo.co | @eldo_co
