Clinton-Trump Is the Oldest U.S. Presidential Election in History
But relative to life expectancy are they really all that old?
AUG 5 2016
Introduction - Analysis
Appendix I: A Closer Look at Democrats and Republicans, Clinton and Trump
Appendix II: The Oldest and Youngest Candidates in History (Relative to Life Expectancy)
But relative to life expectancy are they really all that old?
AUG 5 2016
Introduction - Analysis
Appendix I: A Closer Look at Democrats and Republicans, Clinton and Trump
Appendix II: The Oldest and Youngest Candidates in History (Relative to Life Expectancy)
Appendix II: The Oldest and Youngest Presidential Candidates in American History (Relative to Life Expectancy)
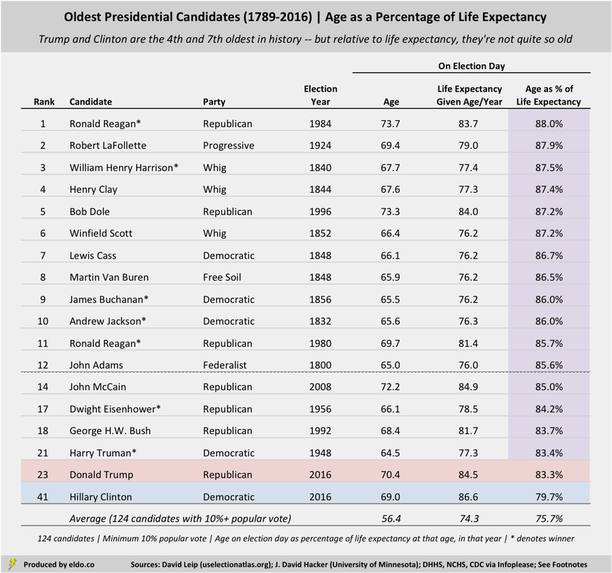
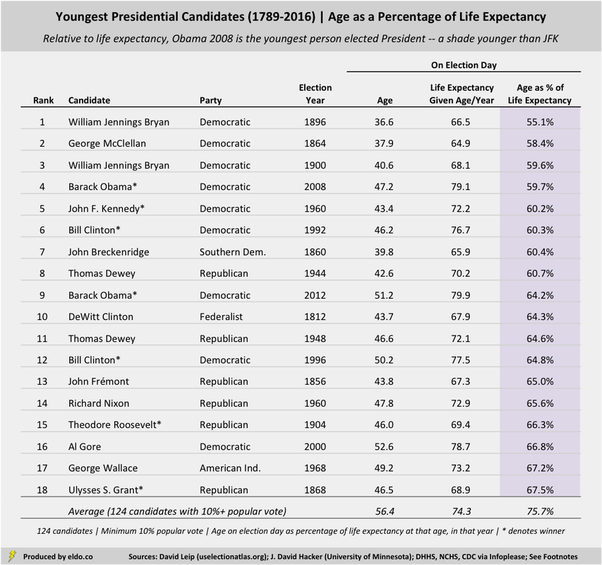
For those who might have arrived in this section without having read the previous sections, the tables below present the “oldest” and “youngest” presidential candidates in American history based on a candidate’s election-day age as a percentage of his or her life expectancy (at that particular age and in that particular year).
On the old side of the ledger, we’d be remiss if we didn’t point out a couple of things. First, if we reduce our minimum from 10% to 1% of the popular vote (or thereabouts), the two oldest candidates in history are John Bidwell (Prohibition, 1892) and George Clinton (Democratic-Republican, 1808)[1].
Bidwell was 73.2 years old on Election Day in 1892. At that time, a 73-year-old man could expect to live to about 80.5, meaning Bidwell was 91% of the way through his expected life. He finished fourth in the popular vote with 2.2%. Clinton was 69.3 in 1808; he could expect to live to 77.9 and was thus 89% of the way through his expected life. (Clinton won six of 176 electoral votes at a time when electors were appointed by state legislatures in a number of states, rather than by popular vote.)
Second, had Bernie Sanders upset Hillary Clinton in the Democratic primary, he would have been the oldest candidate in history in terms of raw age. (Sanders will be 75.1 years old on Election Day.) But thanks to today’s enhanced life expectancy, Sanders barely cracks the top ten in terms of age as a percentage of projected life. As a 75-year-old male, Sanders can expect to live to 86.4, meaning he’s “only” 87.0% of the way there. That’s good for seventh place in the chart below (10% popular vote minimum) and ninth if we reduce the minimum to 1%.
|
|
Reducing our minimum to 1% of the popular vote on the young side of the ledger would make John Schmitz (American Party, 1972) the second youngest candidate in history relative to life expectancy on Election Day. Schmitz was 42.2 years old, could expect to live to 72.6, and was 58.2% of the way through his expected life at the time. Schmitz took home 1.4% of the popular vote. Strom Thurmond (State’s Rights, 1948) would come in at number ten (45.9, 72.0, 63.8%); he won 2.4% of the popular vote and four states, good for 39 electoral votes. And finally, Allan Benson (Socialist, 1916) would finish 11th (45.0, 70.2, 64.1%); he won 3.2% of the popular vote.
The youth table is otherwise headlined by William Jennings Bryan and George McClellan’s failed bids, and Barack Obama, John F. Kennedy, and Bill Clinton’s successful ones. At 46.6 in 1944 (60.7%), Thomas Dewey was the “youngest” Republican candidate in history. Nixon’s youthful showing in 1960 – a campaign he lost to JFK – should not be confused with his older, winning campaigns in 1968 and 1972. Beyond that, modern readers might be surprised to see Teddy Roosevelt (46.0, 66.3%, 1904) and Ulysses S. Grant (46.5, 67.5%, 1868) make the list of the young.
Relative to life expectancy, President Obama (2008) edges out JFK for the title of “youngest” president in history.

|
|
Footnotes
[1] The National Archives and Record Administration reports no record of the popular vote until 1824. There are some popular vote metrics out there for the 1808 election, but between record keeping considerations and the fact that electors in a number of states were assigned by state legislatures (rather than popular vote), it's tough to know for sure. Clinton won 3.4% of the electoral vote, so we'll throw him in the mix at the reduced minimum. even though all of those votes came by way of the legislature in his home state of New York.
[1] The National Archives and Record Administration reports no record of the popular vote until 1824. There are some popular vote metrics out there for the 1808 election, but between record keeping considerations and the fact that electors in a number of states were assigned by state legislatures (rather than popular vote), it's tough to know for sure. Clinton won 3.4% of the electoral vote, so we'll throw him in the mix at the reduced minimum. even though all of those votes came by way of the legislature in his home state of New York.
Sources
For election information: Leip, David. "David Leip's Atlas of U.S. Presidential Elections". uselectionatlas.org. (c) David Leip, 2008
For life expectancies, 1900 and earlier: Hacker, J. David. "Decennial Life Tables for the White Population of the United States, 1790-1900." Accessed via PubMed Central, a full-text archive of biomedical and life sciences journal literature at the U.S. National Institutes of Health's National Library of Medicine. Published in final edited form as "Hist Methods" 2010 Apr, 43(2): 45-79. J. David Hacker is a Professor at the University of Minnesota.
For life expectancies after 1900: "Life Expectancy by Age, 1850-2011". Infoplease. (c) 2000-2015 Sandbox Networks, Inc., publishing as Infoplease. 30 Jul - 04 Aug 2016 <http://www.infoplease.com/ipa/A0005140.html>. Underlying sources include Death Registration States of 1920; Department of Health and Human Services (DHHS); National Center for Health Statistics (NCHS); Centers for Disease Control and Prevention (CDC); National Vital Statistics Reports.
In the source data, ages are presented in increments of five or ten years. Years are presented decennially or for specific years. For candidate ages and election years that fell between (or after) those presented, I interpolated (or extrapolated) life expectancies based on the data available.
Data was compiled and analyzed by ELDORADO. All charts and graphics herein were created by ELDORADO.
ELDORADO | Berkeley, CA | New York, NY
eldo.co | @eldo_co
ELDORADO | Berkeley, CA | New York, NY
eldo.co | @eldo_co
