Clinton-Trump Is the Oldest U.S. Presidential Election in History
But relative to life expectancy are they really all that old?
AUG 5 2016
Introduction - Analysis
Appendix I: A Closer Look at Democrats and Republicans, Clinton and Trump
Appendix II: The Oldest and Youngest Candidates in History (Relative to Life Expectancy)
But relative to life expectancy are they really all that old?
AUG 5 2016
Introduction - Analysis
Appendix I: A Closer Look at Democrats and Republicans, Clinton and Trump
Appendix II: The Oldest and Youngest Candidates in History (Relative to Life Expectancy)
Appendix I: A Closer Look at Democrats and Republicans, Clinton and Trump
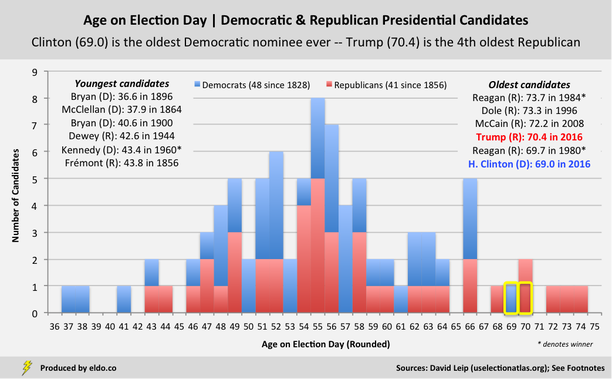
The Democratic Party dates back to 1828, when Andrew Jackson became its first presidential nominee; he won two terms. Hillary Clinton is the party’s 48th nominee. At nearly 69 years old[1], she is also its oldest.
Twenty-eight years later, the Republicans kicked things off with 43-year-old John Frémont (1856). Frémont lost to James Buchanan in the very first Republican-Democrat presidential election, but he holds the distinction of being the second youngest GOP candidate in history (and the only major candidate with an accent in his name).
At 70 years old, Donald Trump is a far cry from Frémont. Trump is the fourth oldest of 41 Republican nominees – and fourth oldest of all 124 candidates in history who earned, or are projected to earn[2], at least 10% of the popular vote - behind only Ronald Reagan (73.7 in 1984), Bob Dole (73.3 in 1996), and John McCain (72.2 in 2008). (Clinton is sixth oldest among major party candidates and seventh among the broader group of 124.)
The following chart shows just how far afield (old) Clinton and Trump are relative to the rest of their party's presidential candidates:
|
|
Clinton is 1.7 standard deviations above the mean (56.4 years) for the 124 candidates in our larger sample. Democratic candidates are slightly younger on average (54.3 years), so Clinton’s outlier status is more pronounced among her party peers (2.1 standard deviations). Trump stands at 1.8 standard deviations among the 124-candidate mean and 1.7 standard deviations above the Republican mean (56.7 years).
Democrats’ reputation as the party of the young and Republicans’ reputation as the party of the old are reflected in their candidates. The average GOP nominee is about 2.5 years older than the average Democrat. Six of the seven oldest major party candidates are Republicans, while four of the five youngest are Democrats.
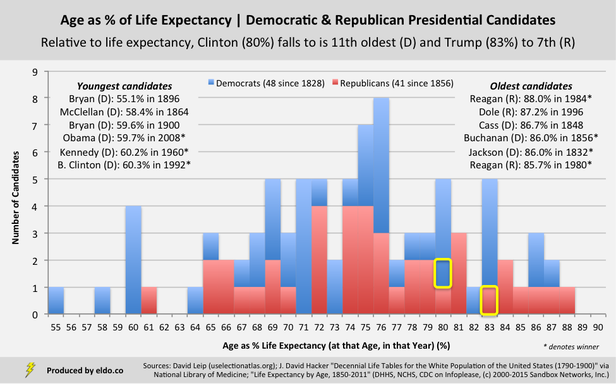
As we saw in the previous section, when we consider age in context of life expectancy, Clinton and Trump fall in the age rankings, migrating toward the center of the chart:
|
|
As a 69-year-old woman (on Election Day), Clinton can expect to live to 86.6, meaning she is 80% of the way through her projected life. Measured this way, Clinton falls from first to 11th oldest among 48 Democrats, and seventh to 41st among the 124 candidates in history with 10% or more of the popular vote. She barely cracks the top third of the broader group and is only about half a standard deviation above its average (75.7%).
Clinton is “younger” than James Buchanan (65.6, 86% of the way through life in 1856), Andrew Jackson (61.6, 83% in 1828; 65.6, 86% in 1832), Harry Truman (64.5, 83% in 1948), Franklin Roosevelt (62.8, 82% in 1944), and Woodrow Wilson (59.8, 80% in 1916) – all Democrats who won the presidency. Given how much life she projects to have left, Clinton would become the 20th “oldest” of 58 election winners, were she to win the White House. (On average, elected presidents are 56.6 years old and 76% of the way through life at the time of election.[3])
Men generally don't live as long as women, and as such, Trump doesn’t fall quite as far as Clinton when we adjust for life expectancy. At 70 years old, Trump can expect to live to 84.5, meaning his life projects to be 83% complete. That bumps him from fourth oldest to seventh among Republicans, and fourth to 23rd among the 124 candidates with ten-plus percent of the popular vote – about one standard deviation above average. Were he to win, Trump would be the tenth “oldest” of 58 elected commanders-in-chief, in similar company as Dwight Eisenhower in 1956 (66.1, 84%), Harry Truman in 1948 (64.5, 83%), and FDR in 1944 (62.8, 82%).
Hillary Clinton and Donald Trump are old candidates, but where they are in life is fairly typical for presidential candidates.
In Appendix II, we’ll leave you with the oldest and youngest candidates in history according to our “election-day age as a percentage of life expectancy” metric, highlighting a few notables and Clinton and Trump.

|
|
Footnotes
[1] Hillary Clinton turns 69 years old on October 26, about two weeks before Election Day.
[2] Gary Johnson currently projects to win 6.6% of the popular vote, which may very well change. For now he is excluded. The National Archives and Records Administration lists no official record of the popular vote until 1824. For purposes of this analysis, we applied common historical convention and incorporated two major candidates from 1796 through 1820 and one major candidate in 1788-89 and 1792 (George Washington) into our analysis.
[3] "Elected presidents" excludes those vice presidents who assumed the presidency due to the death or resignation of the president.
Sources
For election information: Leip, David. "David Leip's Atlas of U.S. Presidential Elections". uselectionatlas.org. (c) David Leip, 2008
For life expectancies, 1900 and earlier: Hacker, J. David. "Decennial Life Tables for the White Population of the United States, 1790-1900." Accessed via PubMed Central, a full-text archive of biomedical and life sciences journal literature at the U.S. National Institutes of Health's National Library of Medicine. Published in final edited form as "Hist Methods" 2010 Apr, 43(2): 45-79. J. David Hacker is a Professor at the University of Minnesota.
For life expectancies after 1900: "Life Expectancy by Age, 1850-2011". Infoplease. (c) 2000-2015 Sandbox Networks, Inc., publishing as Infoplease. 30 Jul - 04 Aug 2016 <http://www.infoplease.com/ipa/A0005140.html>. Underlying sources include Death Registration States of 1920; Department of Health and Human Services (DHHS); National Center for Health Statistics (NCHS); Centers for Disease Control and Prevention (CDC); National Vital Statistics Reports.
In the source data, ages are presented in increments of five or ten years. Years are presented decennially or for specific years. For candidate ages and election years that fell between (or after) those presented, I interpolated (or extrapolated) life expectancies based on the data available.
Data was compiled and analyzed by ELDORADO. All charts and graphics herein were created by ELDORADO.
ELDORADO | Berkeley, CA | New York, NY
eldo.co | @eldo_co
ELDORADO | Berkeley, CA | New York, NY
eldo.co | @eldo_co
